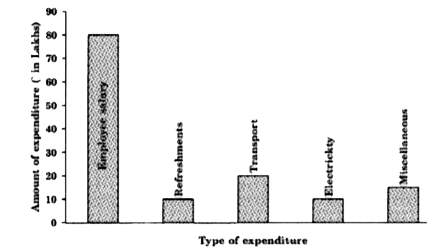
The graph shows the monthly expenditure of a company (unit = 10 lakhs). Study the graph and answer the questions :
The total monthly expenditure of the company is :
ग्राफ में किसी कम्पनी के मासिक व्यय को दर्शाया गया है। ग्राफ का अध्ययन कीजिए और निम्नलिखित प्रश्नों के उत्तर दीजिए।
कम्पनी का कुल मासिक व्यय कितना है ?
153 Lakhs/लाख
315 Lakhs /लाख
135 Lakhs/लाख
531 Lakhs/लाख
The correct Answer is:C
कुल मासिक व्यय = Rs 135 लाख
Similar Questions
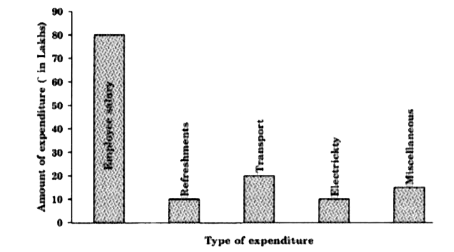
The graph shows the monthly expenditure of a company (unit = 10 lakhs). Study the graph and answer the questions :
The ratio between transport and employee salary on monthly basis is
ग्राफ में किसी कम्पनी के मासिक व्यय को दर्शाया गया है। ग्राफ का अध्ययन कीजिए और निम्नलिखित प्रश्नों के उत्तर दीजिए।
मासिक आधार पर परिवहन और कर्मचारियों के वेतन के बीच अनुपात कितना है ?
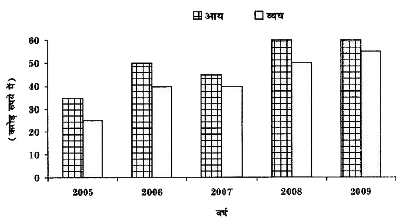
View SolutionStudy the following graph which shows income and expenditure of a company over the years and answer the questions.
Ratio of total income to total expenditure of the company over the years is.
निम्नलिखित चार्ट का अध्ययन कीजिए जिसमें कंपनी की कुछ वर्षों की आय एवं उसके व्यय को दर्शाया गया है और प्रश्नों के उत्तर दीजिए :
दिए गए वर्षों में कंपनी की कुल आय और कुल व्यय का अनुपात क्या रहा?
View Solution
Knowledge Check
The bar diagram shows the monthly expenditure of a company. Study the graph and answer the questions.
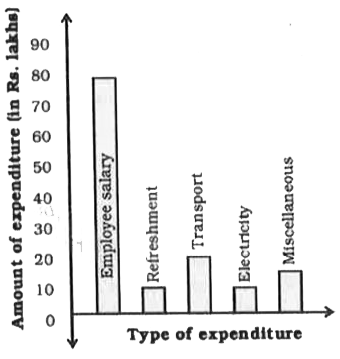
The total monthly expenditure of the company is :ARs. 153 lakhsBRs. 315 lakhsCRs. 135 lakhsDRs. 531 lakhsThe bar diagram shows the monthly expenditure of a company. Study the graph and answer the questions.
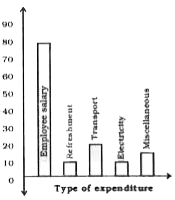
The total monthly expenditure of the company is :ARs. 153 lakhsBRs. 315 lakhsCRs. 135 lakhsDRs. 531 lakhs
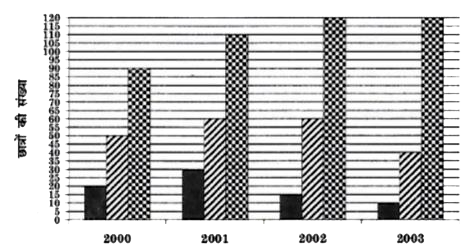
The graph shows the result of 10th class students of a school for 4 years. Study the graph and answer the questions:
The number of students appeared for the 10th class exam in the year 2002 is.
निम्नलिखित दण्ड आरेख 10 वीं कक्षा के छात्रों का 4 वर्ष का परीक्षा परिणाम दर्शाता है। आरेख का अध्ययन कीजिए और निम्नलिखित प्रश्नों का उत्तर दीजिए : छात्रों की संख्या
वर्ष 2002 में 10 वीं कक्षा की परीक्षा में शामिल छात्रों की संख्या बताइए:
View SolutionThe given graph represents the percentage distribution of the total expenditure of a company. Study the graph and answer the question that follows.
दिया गया आरेख एक कंपनी के कुल व्यय के प्रतिशत वितरण को दर्शाता है। आरेख का अध्ययन कीजिए और फिर पूछे गए प्रश्न का उत्तर दीजिए।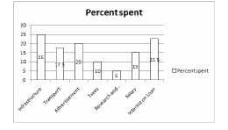 The total expenditure of the company is how many times the total expenditure on .Research
and Development. and .Salary.?
कंपनी का कुल व्यय .शोध तथा विकास (Reaserch and Development)’ और .वेतन.(Salary) पर किये गए कुल व्यय से कितना गुना है ?
View SolutionThe given graph represents the percentage distribution of the total expenditure of a company. Study the graph and answer the question that follows.
दिया गया आरेख एक कंपनी के कुल व्यय के प्रतिशत वितरण को दर्शाता है। आरेख का अध्ययन कीजिए और फिर पूछे गए प्रश्न का उत्तर दीजिए।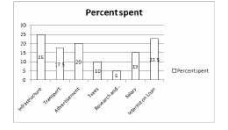 What is the ratio of the total expenditure on .Infrastructure. and .Transport. to the total expenditure on .Taxes. and .Interest on Loans.?
‘आधारभूत संरचना’(Infrastructure) तथा “परिवहन. (Transport) पर किये गए कुल व्यय और “करों (Taxes) तथा “ऋण पर ब्याज.(Interest on loans) पर किये गए कुल व्यय के बीच अनुपात ज्ञात कीजिए।
View SolutionThe given graph represents the percentage distribution of the total expenditure of a company. Study the graph and answer the question that follows.
दिया गया आरेख एक कंपनी के कुल व्यय के प्रतिशत वितरण को दर्शाता है। आरेख का अध्ययन कीजिए और फिर पूछे गए प्रश्न का उत्तर दीजिए। The expenditure on .Interest on loans. is what percentage more than the expenditure on
.Transport.?
.ऋण पर ब्याज. (Interest on loans) में किया गया व्यय “परिवहन (Transport) पर किये गए व्यय से कितना प्रतिशत अधिक है ?
View SolutionThe distribution of fruit consumption in a sample of 73 seventeen-year-old girls is given in the graph below. Study the graph and answer the questions :
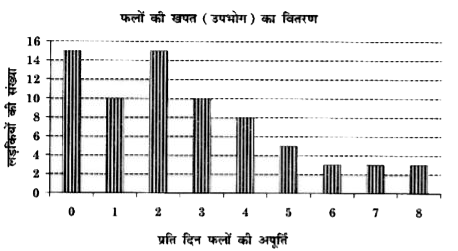
What percent of these girls ate six or more servings per day?
निम्नलिखित ग्राफ में 72 सत्रह - वर्षीय लड़कियों के सैम्पल में फलों की खपत (उपभोग) के विवरण को दर्शाया गया है। ग्राफ का अध्ययन कीजिए और प्रश्नों के आधार पर उत्तर दीजिए:
प्रति दिन छह या अधिक आपूर्ति किए गए फलों को खाने वाली इन लड़कियों का प्रतिशत क्या था?
View SolutionThe distribution of fruit consumption in a sample of 73 seventeen-year-old girls is given in the graph below. Study the graph and answer the questions :
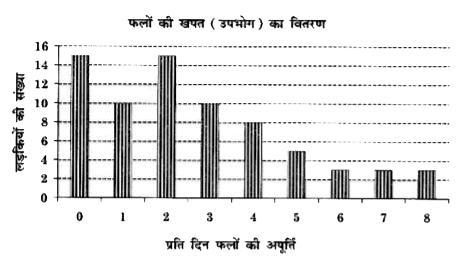
How many of these girls ate fewer than two servings per day?
निम्नलिखित ग्राफ में 72 सत्रह - वर्षीय लड़कियों के सैम्पल में फलों की खपत (उपभोग) के विवरण को दर्शाया गया है। ग्राफ का अध्ययन कीजिए और प्रश्नों के आधार पर उत्तर दीजिए:
इनमें से कितनी लड़कियों ने प्रति दिन दो से कम आपूर्ति किए गए फलों को खाया?
View Solution
