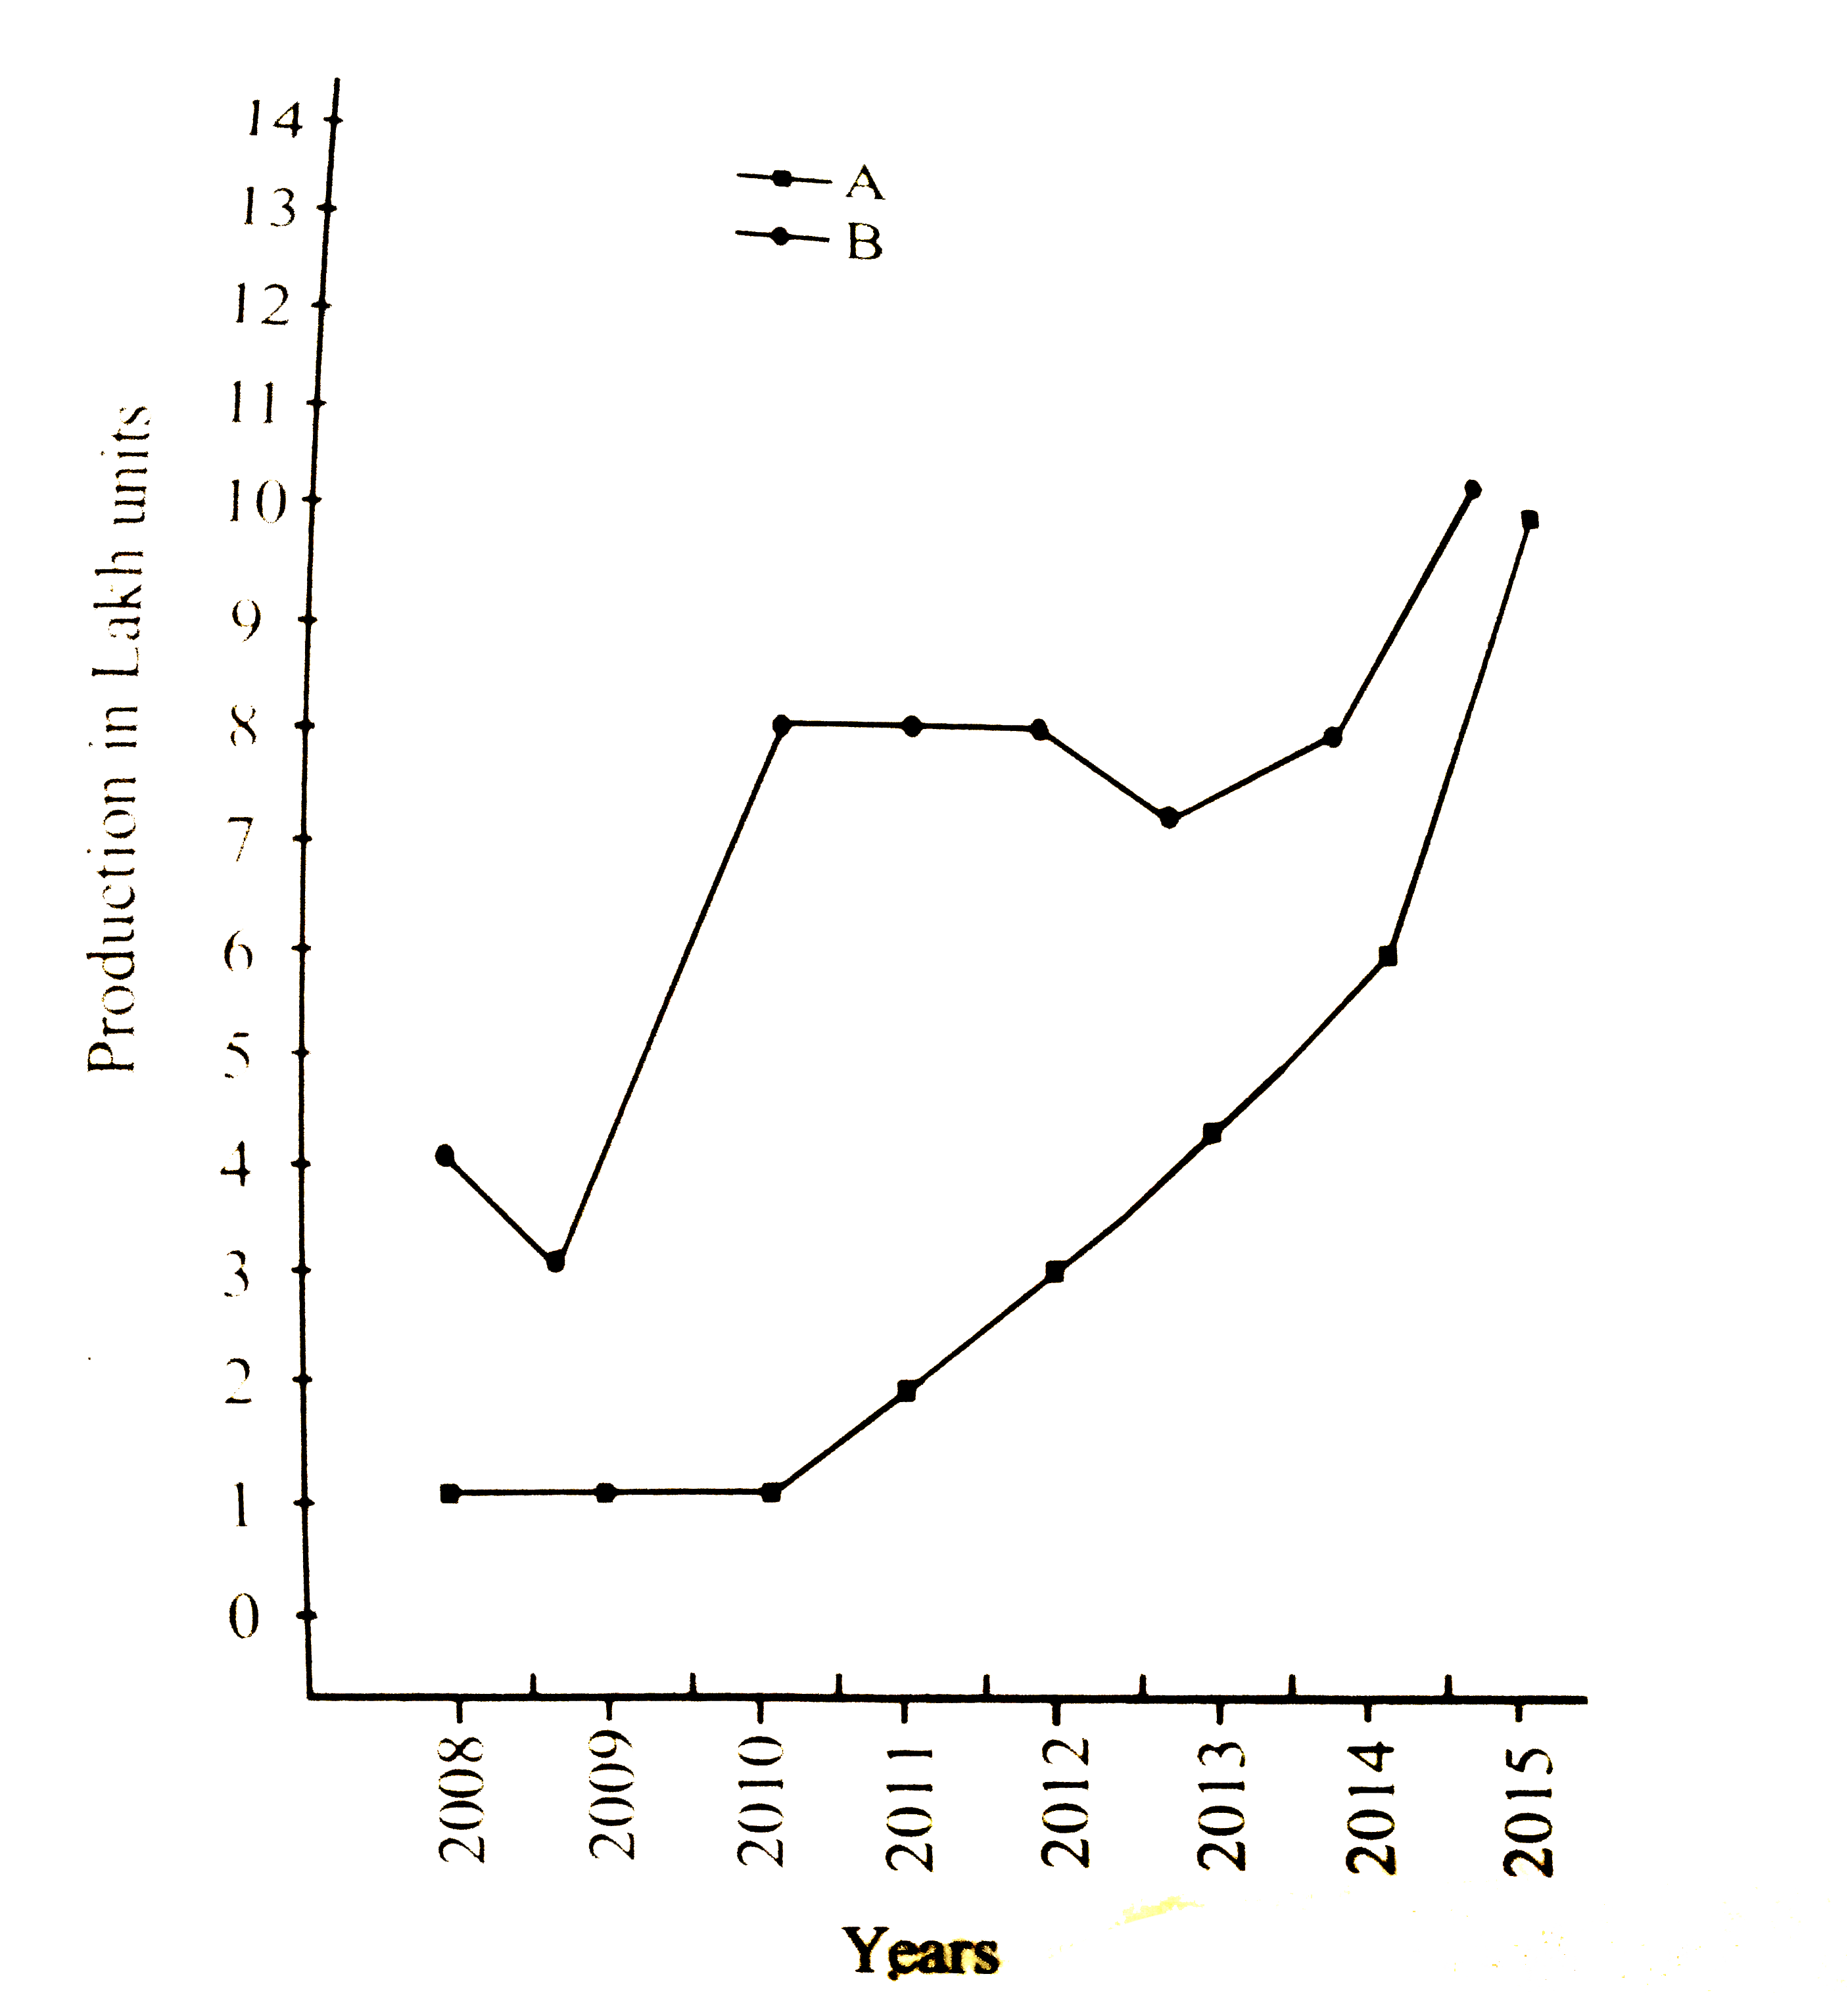
Which of the following is the closest average production in lakh units of Company B for the given years ?
R and U
S and R
T and R
P and t
The correct Answer is:C
Step by step video, text & image solution for Which of the following is the closest average production in lakh units of Company B for the given years ? by Maths experts to help you in doubts & scoring excellent marks in Class 14 exams.
Updated on:21/07/2023Topper's Solved these Questions
Similar Questions
Direction : Study the following bar diagram carefully and answer the four questions.
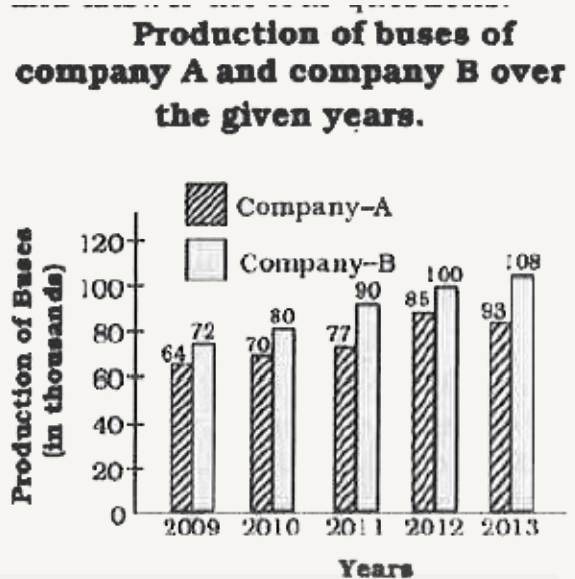
The average production (in thousand) of the company B over the years 2009, 2011, 2012, 2013 is
View SolutionRead the following graph carfully and answer the questions given below. Production of bulbs by different companies in three years (In lakhs)
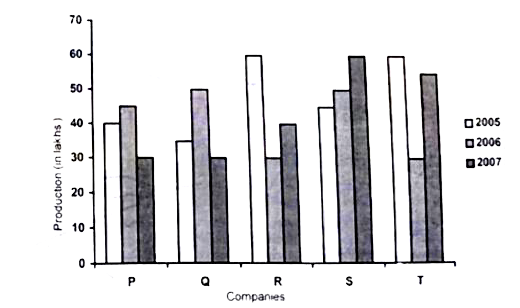
What is the ratio of average production of company Q to the average production of company T in all the given years?
View Solution
Knowledge Check
Study the following graph to answer the given questions -----
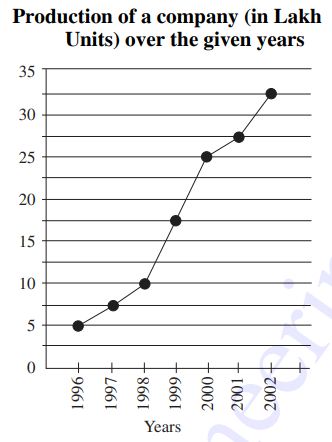
What is the approximate average production (in lakhs) for the given years ?A18B19C20D18.5Production of steel in different companies in three consecutive years (in lakh tonnes)
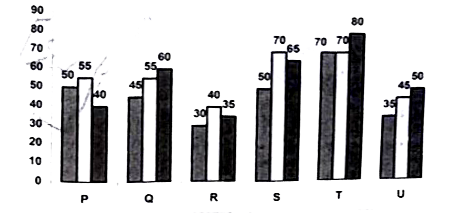
In which of the following pairs of companies the difference between average production for the three years is maximum?AT and UBS and RCT and RDP and TStudy the following bar diagram carefully and answer the four questions.
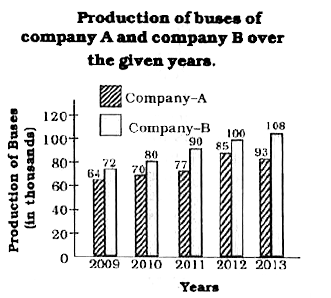
The average production (in thousand) of the company B over the years 2009, 2011, 2012 isA87.33B80.67C90.33D84
Comprehesion:
Study the following table and answer the question besed on it.
Following table gives the expenditures of a company (in lakh rupees) per annum over the given years.
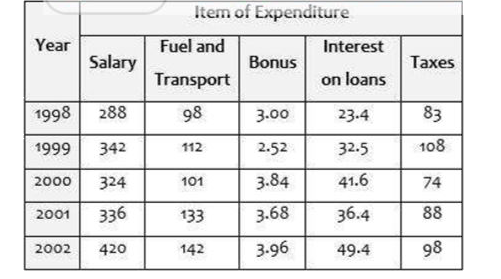
The total expanditure of the company over the items diring the years 2001 is -
View Solution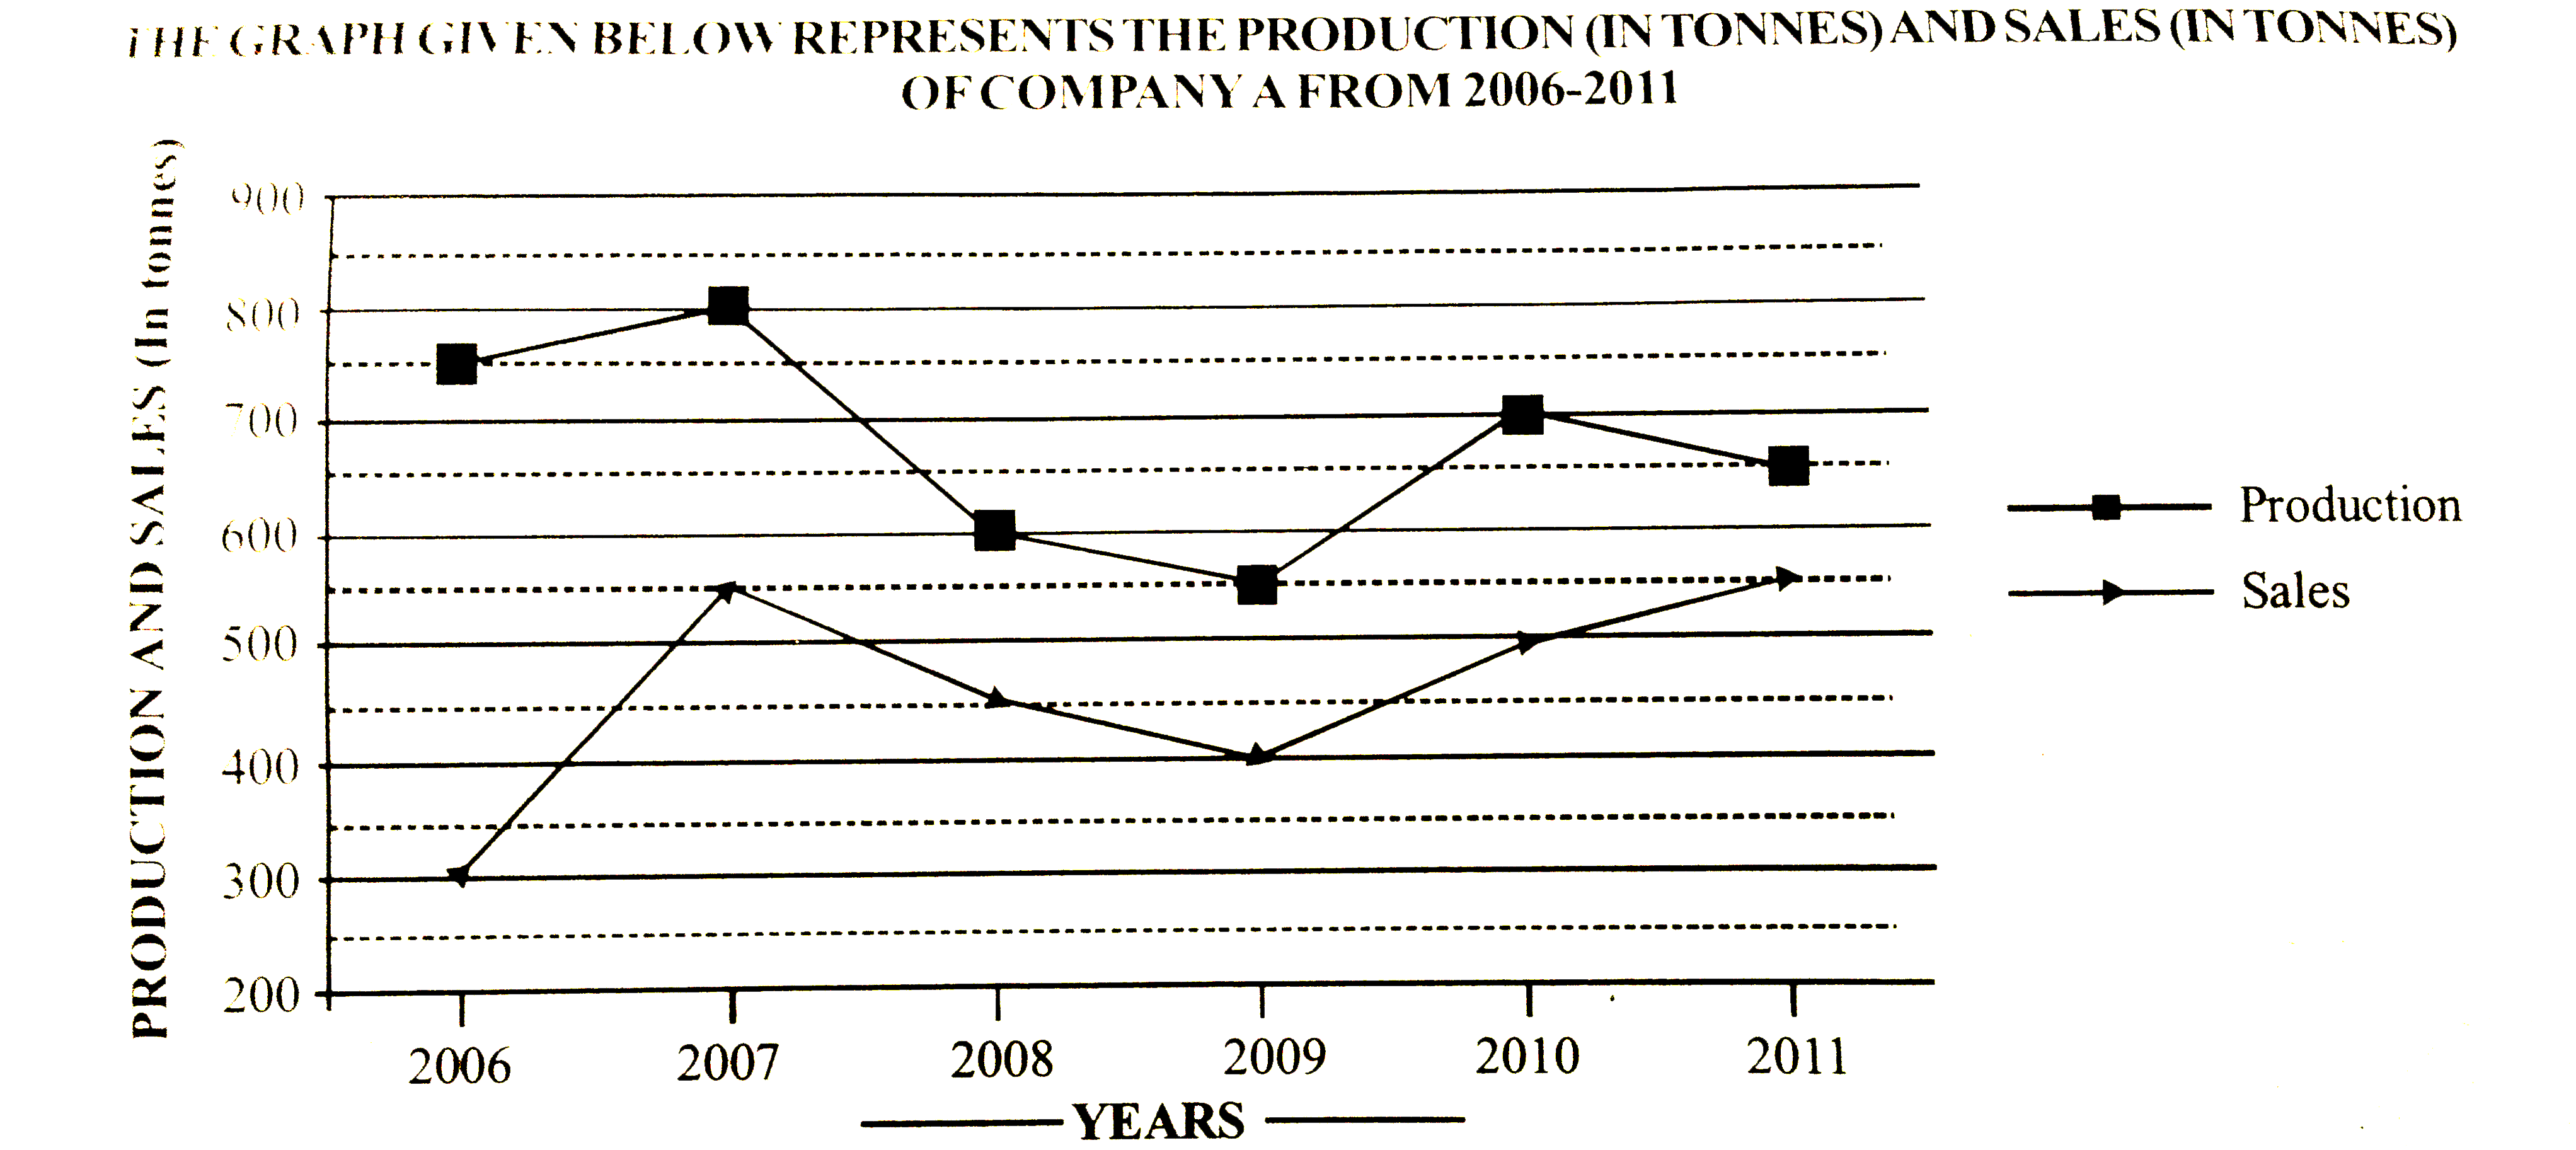
The table given below represents the respective ratio of the production (in tonners) of Company A to the production (in tonnes) of Company B, and the respective ratio of the sales (in tonnes )of Company A to the sales (in tonnes) of Company. B.
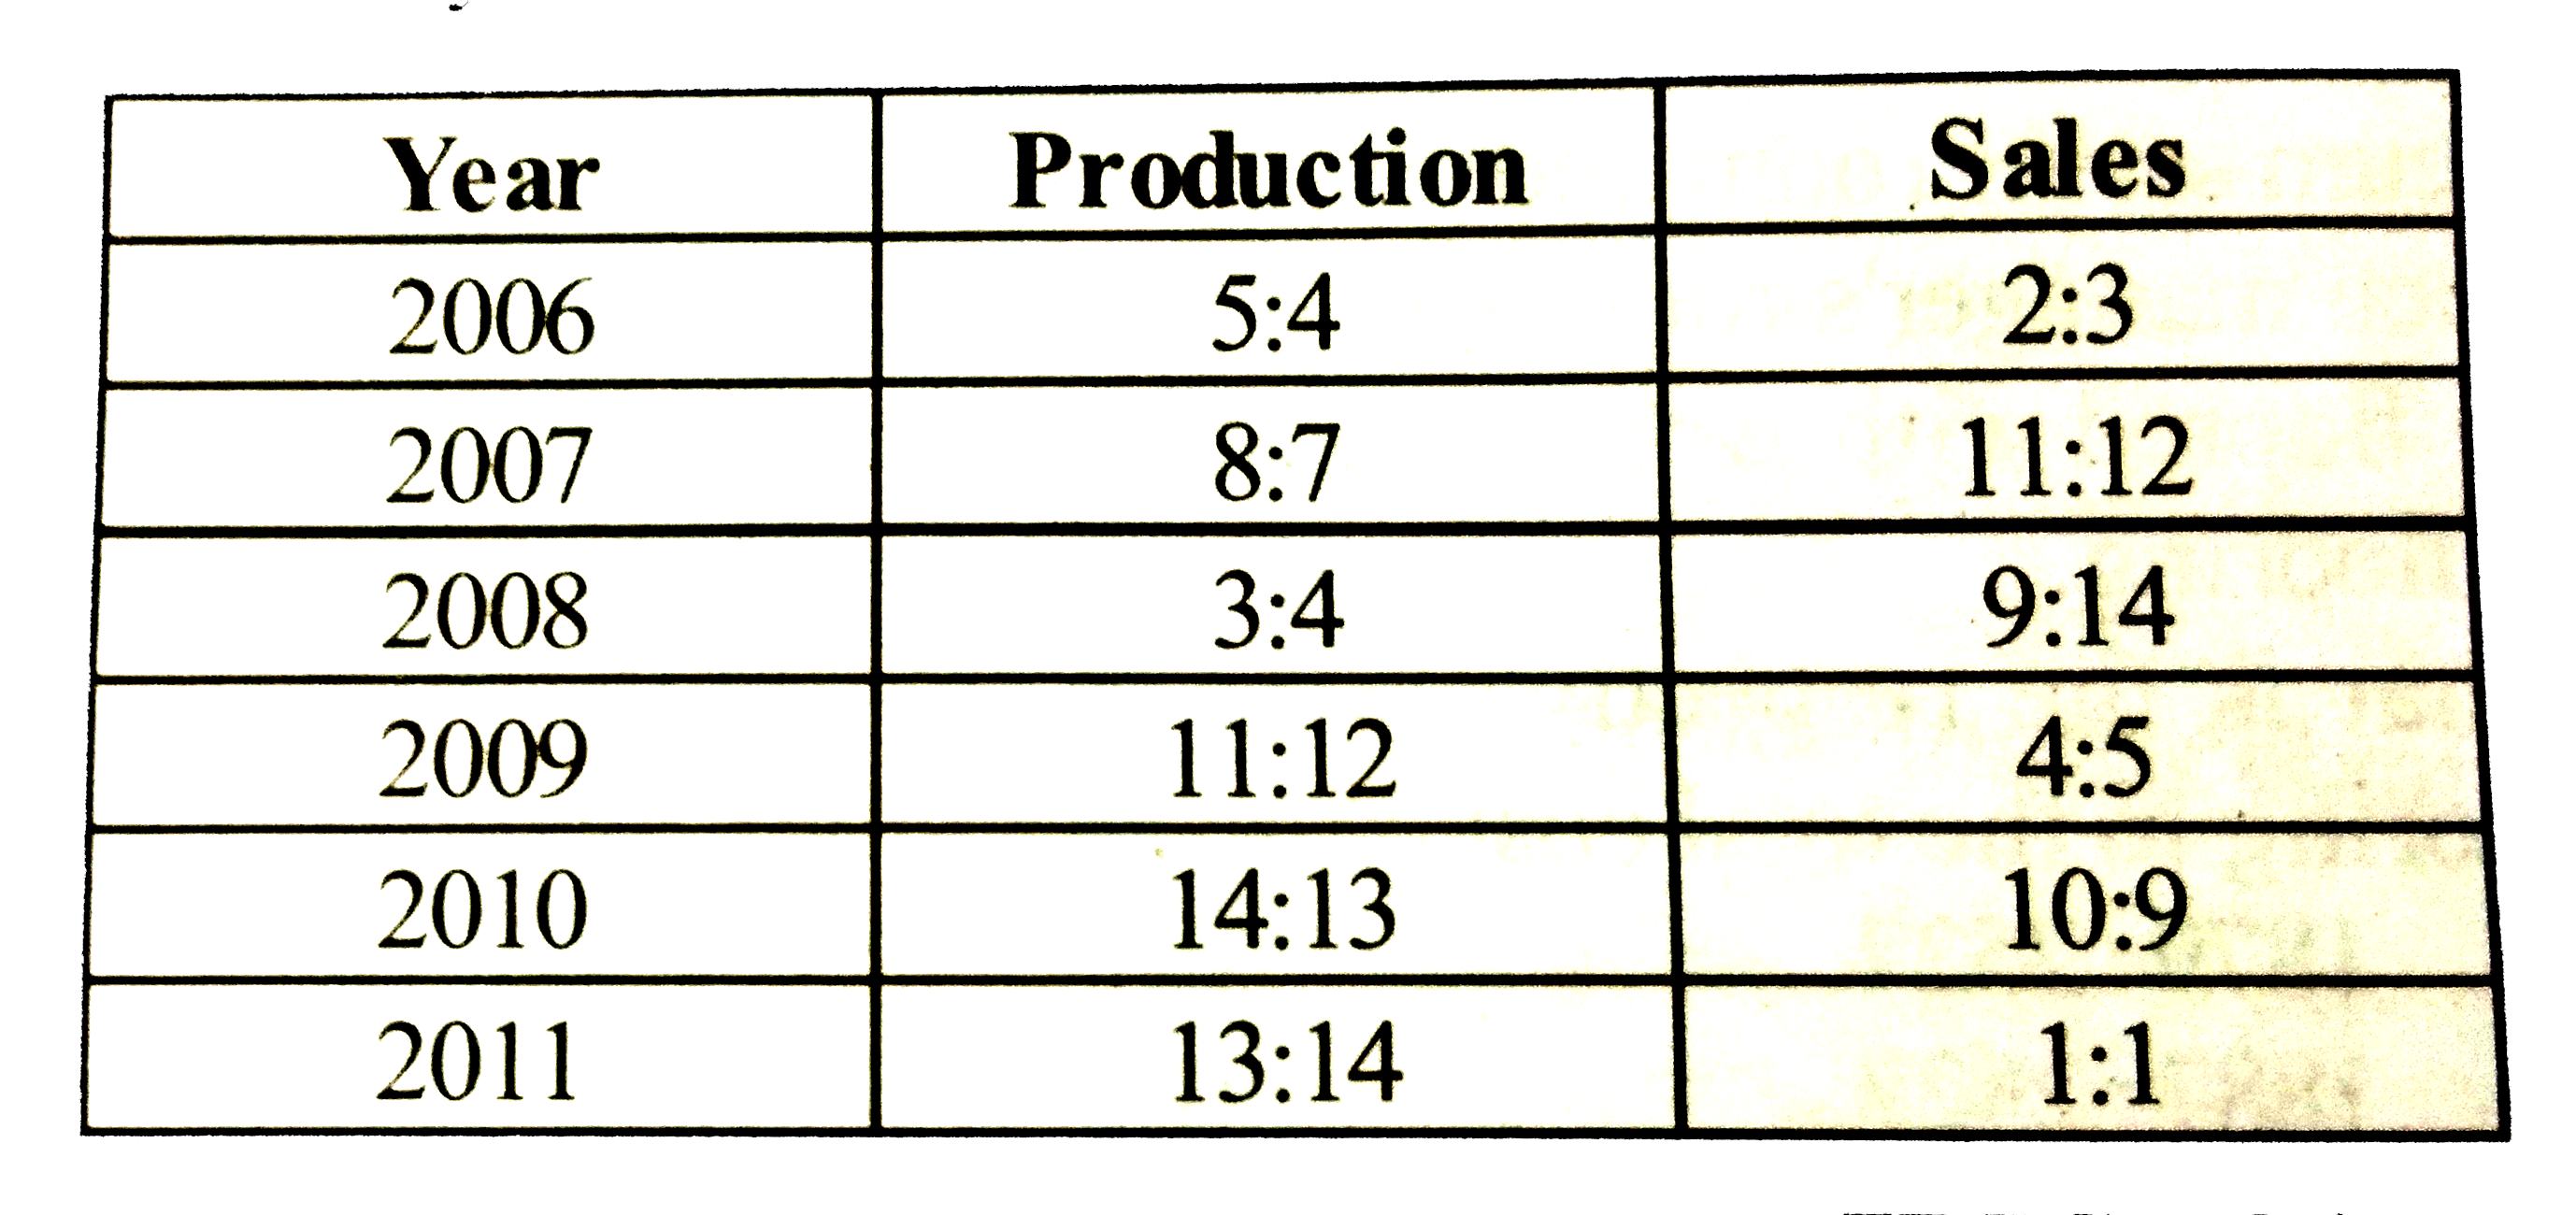
What is the average production of Company B (in tonnes from the year 2006 to the year 2011?
View SolutionStudy the following line graph and answer the question based on it.
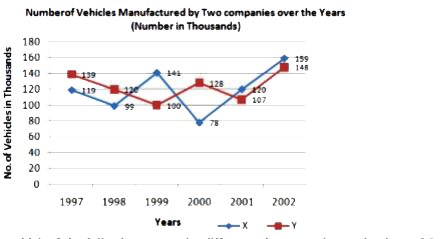
In which of the following years, the difference between the productions of Companies X and Y was the minimum among the given years?
View SolutionThe bar graph provided below gives the data of the production of paper (in lakh tonnes) by three different companies X, Y and Z over the years. Study the bar chart and answer the following questions.
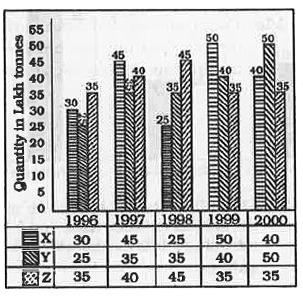
The ratio of the average production of company X in the production of company X in the period 1998-2000 to the average production of company Y in the same period is :
View SolutionThe bar graph provided below gives the data of the production of paper (in lakh tonnes) by three different companies X, Y and Z over the years. Study the bar chart and answer the following questions.
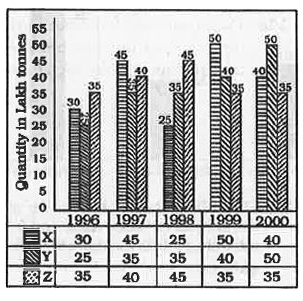
The percentage of production of company Z to the production of company Y is maximum in :
View Solution
