Study the following graph carefully to answer the questions that follows
The % of five different types of cars produced by a company during two years is given below:
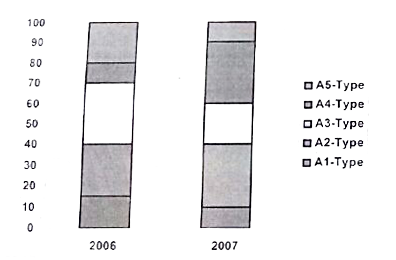
If 85% of A, type cars produced during 2006 and 2007 are being sold by the company, then how many A, type cars left unsold by the company?
21000
22500
21300
24200
The correct Answer is:C
Step by step video, text & image solution for Study the following graph carefully to answer the questions that follows The % of five different types of cars produced by a company during two years is given below: If 85% of A, type cars produced during 2006 and 2007 are being sold by the company, then how many A, type cars left unsold by the company? by Maths experts to help you in doubts & scoring excellent marks in Class 14 exams.
Updated on:21/07/2023Topper's Solved these Questions
Similar Questions
If 85% of the S type cars produced in each year were sold by the company, how many S type cars remained unsold?
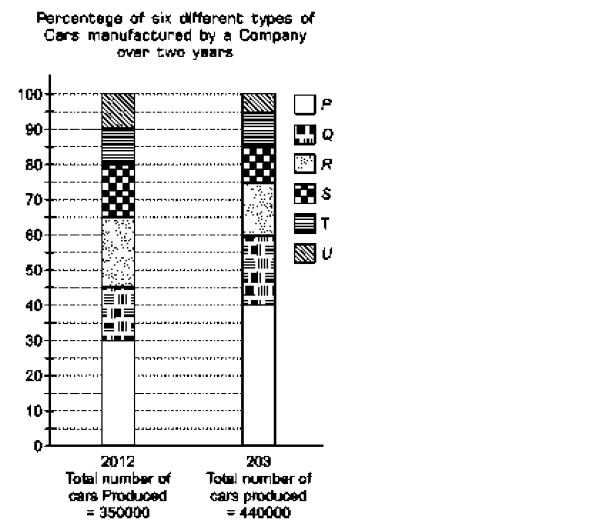
View SolutionRead the following graph carefully and answer the questions given below.
Percentage of cars of 6 different models produced by a company in two years.
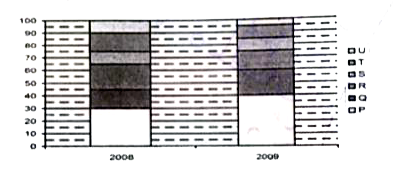
What is the difference between number of T model cars in year 2008 and 2009 ?
View Solution
Knowledge Check
Study the following graph carefully to answer the questions that follows
The % of five different types of cars produced by a company during two years is given below:
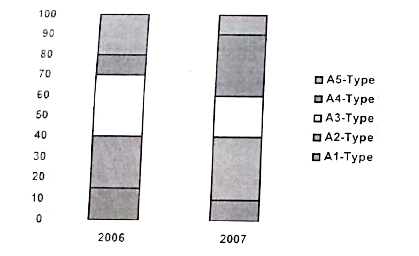
what is the approximate % share of A1 type in the total production of 2007?A10B13C15D9Study the following graph carefully to answer the questions that follows
The % of five different types of cars produced by a company during two years is given below:
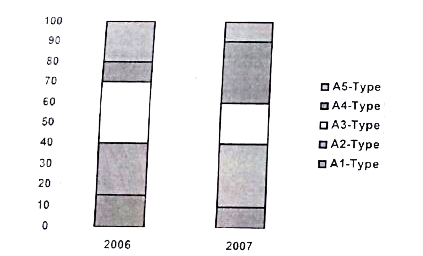
In the case of which of the following types of cars was the % increase from 2006 to 2007 the maximum?AA1BA2CA3DA4Study the following graph carefully to answer the questions given below.
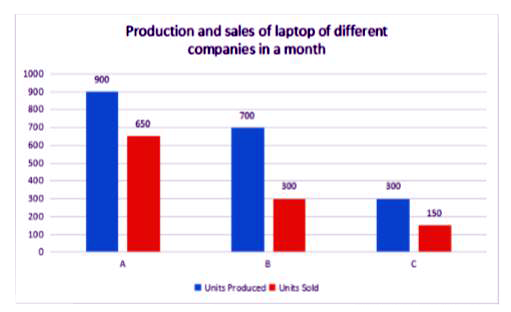
What is the average number of Units produced by all the Companies together?A62513B63313C63323D62313
Read the following graph carefully and answer the questions given below.
Percentage of cars of 6 different models produced by a company in two years.
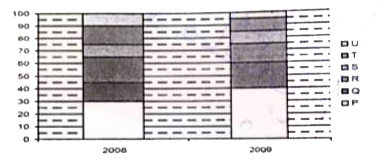
What is the total number of cars of P, Q and T models in year 2008 ?
View SolutionStudy the following graph carefully and answer the questions that follow
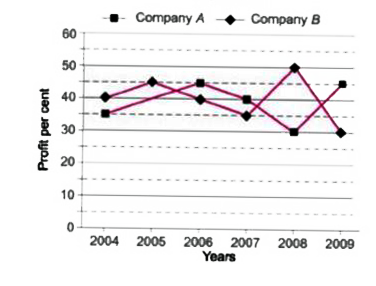
If the amount of profit earned by company A in the year 2007 was ? 1.5 lakh , what was its expenditure in that year ?
View SolutionRead the following graph carefully and answer the questions given below.
Percentage of cars of 6 different models produced by a company in two years.
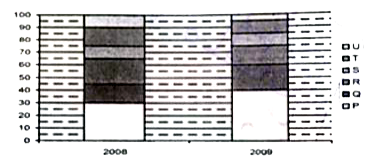
In 2009 the number of P model cars is what percent that of U model cars ?
View SolutionRead the following graph carefully and answer the questions given below.
Percentage of cars of 6 different models produced by a company in two years.
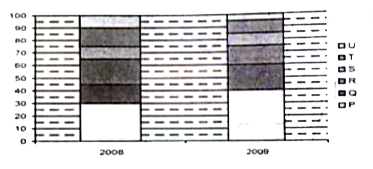
What is the percentage increase in a number of car of Q model from 2008 to 2009 ?
View SolutionStudy the following graph carefully and answer the questions that follow
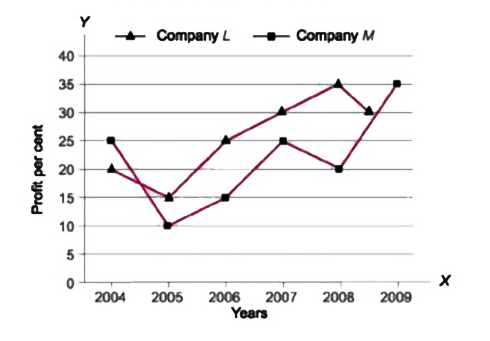
What was the percentage increase in percent rise in profit of company M in the year 2009 from the previous year ?
View Solution
