Study the following graph carefully to answer the questions given below it Import and Export of spare parts by an automobile company over the given years
During which year the percentage rise/fall in exports from the previous year is the highest?
2001
2004
2005
2007
The correct Answer is:B
Step by step video, text & image solution for Study the following graph carefully to answer the questions given below it Import and Export of spare parts by an automobile company over the given years During which year the percentage rise/fall in exports from the previous year is the highest? by Maths experts to help you in doubts & scoring excellent marks in Class 14 exams.
Updated on:21/07/2023Topper's Solved these Questions
Similar Questions
Study the following graph carefully and answer the questions given below it -----
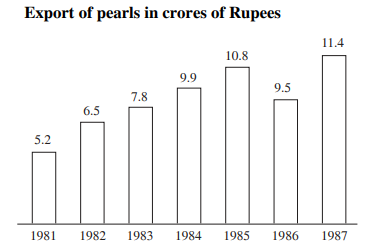
What was the percentage increase in export from 1986 to 1987 ?
View SolutionStudy the following table carefully to answer the questions that follows.
Number of Articles (in thousands) Manufactured (M) and Defective (D) company over the years-
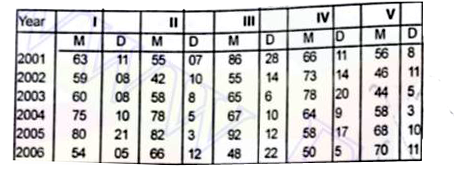
During which year was the percentage increase/decrease in manufacture from the previous year the highest for unit II ?
View Solution
Knowledge Check
Study the following graph carefully to answer the questions given below it Import and Export of spare parts by an automobile company over the given years
What is the ratio of total imports to total exports for all the given years together?A61:57B61:69C69:62D67:63Study the following graph carefully to answer the questions given below it Import and Export of spare parts by an automobile company over the given years
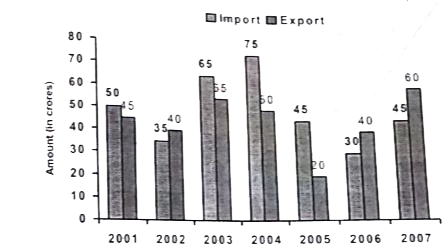
The total exports in the year 2003, 2004 and 2005 together are what percent of the total imports during the same period? (Rounded upto two digits after decimal)A67.56%B62.86%C63.42%D68.12%Study the following graph carefully and answer the questions given below it -----
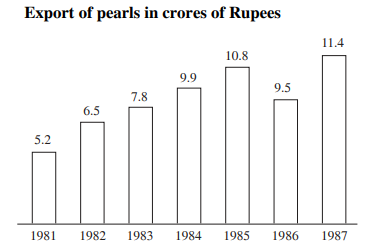
In how many years was the export above the average for the given period ?A2B3C4D5
Study the following graph carefully and answer the questions that follow
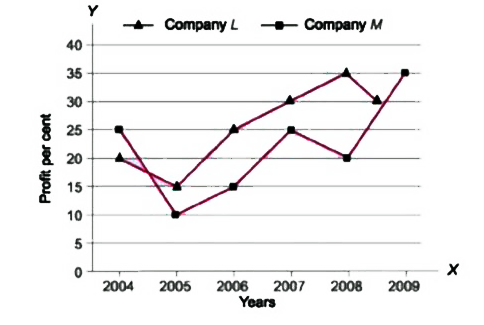
What was the average per cent rise in profit of company L over all the years together ?
View SolutionStudy the following graph to answer the given questions.
Per cent profit earned by two companies over the given years

For Company Y, which year is the percent of increase in percent profit over that of previous year the highest?
View SolutionStudy the following graph carefully and answer the questions given below it -----
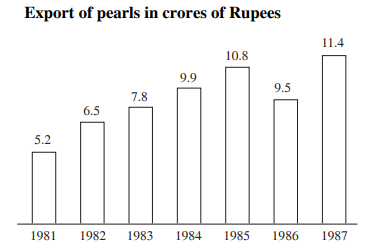
In which of the following pairs of years was the average export of pearls around 9 crores ?
View SolutionStudy the following line graph and answer the questions.
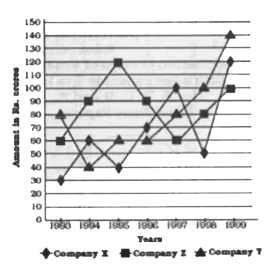
In which year was the exports of all three companies maximum ?
View SolutionStudy the following table carefully and answer the questions given below :
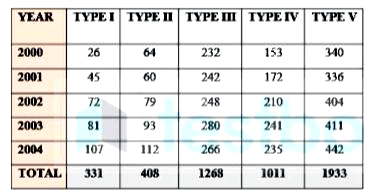
The percentage increase in sales in 2003 over the previous year was maximum for which Type of vehicles
View Solution
