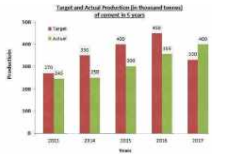
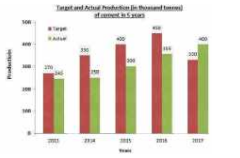
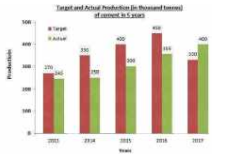
दिए गए दंड आरेख (बार ग्राफ) में किसी फैक्ट्री में पाँच वर्षो के दौरान AC मशीनों के लक्ष्य उत्पादन और वास्तविक उत्पादन को दर्शाया गया है।

किस महीने में AC मशीनों का वास्तविक उत्पादन, लक्ष्य उत्पादन से 25% अधिक था ?
फरवरी
मार्च
जनवरी
मई
The correct Answer is:B
Step by step video, text & image solution for दिए गए दंड आरेख (बार ग्राफ) में किसी फैक्ट्री में पाँच वर्षो के दौरान AC मशीनों के लक्ष्य उत्पादन और वास्तविक उत्पादन को दर्शाया गया है। किस महीने में AC मशीनों का वास्तविक उत्पादन, लक्ष्य उत्पादन से 25% अधिक था ? by Maths experts to help you in doubts & scoring excellent marks in Class 14 exams.
Similar Questions
The bar graph given below shows the target and actual production of cement ( in thousand tons ) during 2013-2017. The ratio of the target production in 2014 and 2016 to the actual total production in 2013, 2016 and 2017 is :
नीचे दिया गया दंड आरेख 2013-2017 के दौरान सीमेंट के लक्षित और वास्तविक उत्पादन (हजार टन में) को दर्शाता है |
वर्ष 2014 और 2016 में सीमेंट के कुल लक्षित उत्पादन और 2013, 2016 तथा 2017 में कुल वास्तविक उत्पादन का अनुपात है :02:36View SolutionThe bar graph given below shows the target and actual production of cement ( in thousand tons ) during 2013-2017. Out of given 5 years, in which years the target production of the cement was 45% more than the average actual production ?
नीचे दिया गया दंड आरेख 2013-2017 के दौरान सीमेंट के लक्षित और वास्तविक उत्पादन (हजार टन में) को दर्शाता है |
दिए गए 5 वर्षों में से किन वर्षों में सीमेंट का लक्षित उत्पादन, सीमेंट के औसत वास्तविक उत्पादन से 45% अधिक था ?02:15View SolutionThe bar graph given below shows the target and actual production of cement ( in thousand tons ) during 2013-2017. What percentage of the total targeted production of cement from 2013 to 2017 is the total actual production in 2014, 2015 and 2017? ( correct to one decimal place )
नीचे दिया गया दंड आरेख 2013-2017 के दौरान सीमेंट के लक्षित और वास्तविक उत्पादन (हजार टन में) को दर्शाता है |
2013 से 2017 तक सीमेंट के कुल लक्षित उत्पादन का कितना प्रतिशत, 2014, 2015 और 2017 में कुल वास्तविक उत्पादन है ? (दशमलव के एक स्थान तक)02:47View SolutionThe following bar graph shows the data of the production of an item (in thousand tonnes) from four different companies A, B, C and D during the year mentioned.
निम्नलिखित दंड आरेख में उल्लिखित वर्षों के दौरान चार अलग-अलग कंपनियों A, B, C और D के द्वारा एक वस्तु (हजार टन में) के उत्पादन का आंकड़ा दिखाया गया है। In the five years given, the average production is highest in company _______ and lowest in company _______, respectively.
दिए गए पांच वर्षों में, औसत उत्पादन कंपनी______में सबसे अधिक है और कंपनी________ में सबसे कम है।03:37View Solutionबायोगैस के उत्पादन में सूक्षम जीव|OMR
31:09View SolutionIn which state the largest number of Kesar is produce - किस राज्य में सबसे अधिक मात्रा में केसर का उत्पादन किया जाता है?
00:56View SolutionStudy the chart carefully and answer the questions. The chart shows production of an item (in tones) during certain years. The production decreased from 2004-05 to 2005 - 06 by निम्न आरेख का ध्यानपूर्वक अध्ययन कर दिए गए प्रश्नों के उत्तर दें: आरेख किसी वर्ष के दौरान एक मद का उत्पादन (टनों में) दर्शाता है। वर्ष 2004-05 से 2005-06 में उत्पादन में कितनी कमी हुई ?
01:12View SolutionStudy the chart carefully and answer the questions. The chart shows production of an item (in tones) during certain years. The production in 2006-07 in comparison to the production in 2002-03 increased by. निम्न आरेख का ध्यानपूर्वक अध्ययन कर दिए गए प्रश्नों के उत्तर दें: आरेख किसी वर्ष के दौरान एक मद का उत्पादन (टनों में) दर्शाता है। वर्ष 2002-03 की तुलना में 2006-07 में उत्पादन में वृद्धि हुई -
01:14View Solution

