निम्नलिखित दण्डारेख में किसी कॉलेज में वर्ष 2000 से वर्ष 2004 तक प्रति वर्ष भर्ती हुए और उत्तीर्ण हुए छात्रों की संख्या दर्शायी गई है। दण्डारेख का अध्ययन करे
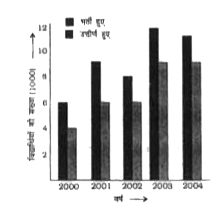
कौन-से दो वर्षों में छात्रों का उत्तीर्ण प्रतिशत 60 से 70 के बीच थी ?
2000 और 2001
2003 और 2004
2001 और 2002
इनमे से कोई नहीं
The correct Answer is:A
Step by step video, text & image solution for निम्नलिखित दण्डारेख में किसी कॉलेज में वर्ष 2000 से वर्ष 2004 तक प्रति वर्ष भर्ती हुए और उत्तीर्ण हुए छात्रों की संख्या दर्शायी गई है। दण्डारेख का अध्ययन करे कौन-से दो वर्षों में छात्रों का उत्तीर्ण प्रतिशत 60 से 70 के बीच थी ? by Maths experts to help you in doubts & scoring excellent marks in Class 14 exams.
Updated on:21/07/2023Similar Questions
Study the following frequency polygon and answer the questions. Given a line graph showing the number of students passed in Higher Secondary Examination in a school over the years 2008 to 2013:
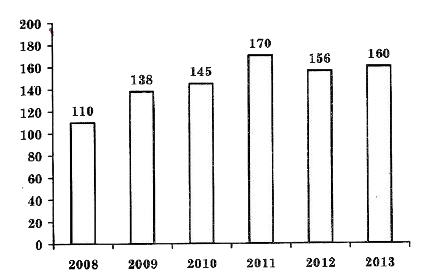
The decrease in percentage of passed students from 2011 to 2012 approximately is.
निम्नलिखित बारम्बारता बहुभुज का अध्ययन करें और दिए गए प्रश्नों के उत्तर दें। नीचे रेखा ग्राफ में एक स्कूल में वर्ष 2008 से 2018 तक के वर्षों में उच्चतर माध्यमिक परीक्षा में उत्तीर्ण होने वाले विद्यार्थियों की संख्या दर्शायी गई है :
वर्ष 2011 से 2012 तक उत्तीर्ण होने वाले विद्यार्थियों की प्रतिशतता में लगभग कितनी कमी आई है?
View SolutionStudy the following frequency polygon and answer the questions. Given a line graph showing the number of students passed in Higher Secondary Examination in a school over the years 2008 to 2013:
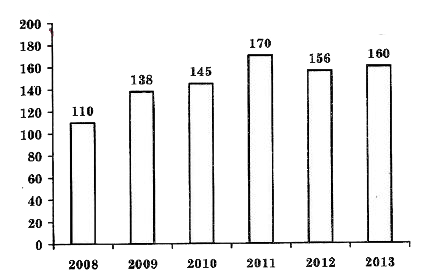
The increase in percentage of passed students from 2008 to 2011 approximately is.
निम्नलिखित बारम्बारता बहुभुज का अध्ययन करें और दिए गए प्रश्नों के उत्तर दें। नीचे रेखा ग्राफ में एक स्कूल में वर्ष 2008 से 2018 तक के वर्षों में उच्चतर माध्यमिक परीक्षा में उत्तीर्ण होने वाले विद्यार्थियों की संख्या दर्शायी गई है :
वर्ष 2008 से 2011 तक उत्तीर्ण होने वाले विद्यार्थियों की प्रतिशतता में लगभग कितनी वृद्धि हुई है?
View SolutionThe graph shows the result of 10th class students of a school for 4 years. Study the graph and answer the questions: The number of students appeared for the 10th class exam in the year 2002 is. निम्नलिखित दण्ड आरेख 10 वीं कक्षा के छात्रों का 4 वर्ष का परीक्षा परिणाम दर्शाता है। आरेख का अध्ययन कीजिए और निम्नलिखित प्रश्नों का उत्तर दीजिए : छात्रों की संख्या वर्ष 2002 में 10 वीं कक्षा की परीक्षा में शामिल छात्रों की संख्या बताइए:
View SolutionThe sub divided bar diagram given below depicts the result of class XII students of a school for three years. Study the diagram and answer the questions given below.
निम्नलिखित दण्ड आरेख तीन वर्षों के लिए एक स्कूल के कक्षा XII के छात्रों का परीक्षा परिणाम दिखाता है। दण्ड आरेख का अध्ययन कीजिए और निम्नलिखित प्रश्नों का उत्तर दीजिए :
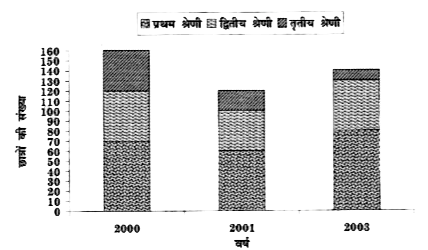
The percentage of students passed with Second class in the year 2000 is
वर्ष 2000 में द्वितीय श्रेणी में उत्तीर्ण हुए छात्रों का प्रतिशत है:
View SolutionThe sub divided bar diagram given below depicts the result of class XII students of a school for three years. Study the diagram and answer the questions given below.
निम्नलिखित दण्ड आरेख तीन वर्षों के लिए एक स्कूल के कक्षा XII के छात्रों का परीक्षा परिणाम दिखाता है। दण्ड आरेख का अध्ययन कीजिए और निम्नलिखित प्रश्नों का उत्तर दीजिए :
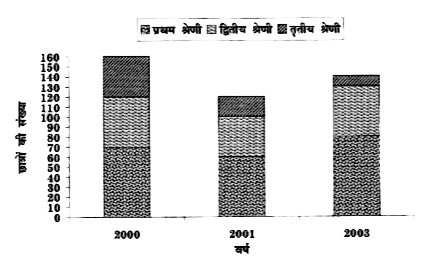
The percentage of students passed with First class in the year 2001 is.
वर्ष 2001 में प्रथम श्रेणी में उत्तीर्ण हुए छात्रों का प्रतिशत है?
View SolutionThe following figure shows the number of students (in thousands) admitted and passed out per your in a college during years 2000 to 2004, study the figure and answer the questions : : निम्नलिखित आकृति में किसी कॉलेज में वर्ष 2000 से वर्ष 2004 तक प्रति वर्ष भर्ती हुए और उर्तीण हुए छात्रों की संख्या (हजार में) दर्शायी गई है। आकृति का अध्ययन कर प्रश्नों के उत्तर दीजिए : The percent increase in the number of students admitted in the year 2003 over that in 2001 is वर्ष 2001 की तुलना में वर्ष 2003 में भर्ती हुए छात्रों की संख्या में हुई प्रतिशत वृद्धि कितनी है ?
View SolutionThe following figure shows the number of students (in thousands) admitted and passed out per your in a college during years 2000 to 2004, study the figure and answer the questions :
: निम्नलिखित आकृति में किसी कॉलेज में वर्ष 2000 से वर्ष 2004 तक प्रति वर्ष भर्ती हुए और उर्तीण हुए छात्रों की संख्या (हजार में) दर्शायी गई है। आकृति का अध्ययन कर प्रश्नों के उत्तर दीजिए :
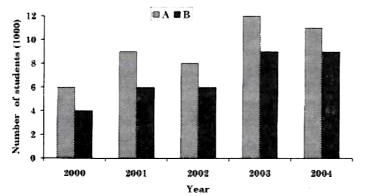
During 2000 to 2003, the ratio of the total number of the students passed out to the total number of students admitted is
वर्ष 2000 से 2003 में भर्ती हुए छात्रों की कुल संख्या और उत्तीर्ण हुए छात्रों की कुल संख्या का अनुपात ज्ञात कीजिए ?
View SolutionThe following figure shows the number of students (in thousands) admitted and passed out per your in a college during years 2000 to 2004, study the figure and answer the questions :
: निम्नलिखित आकृति में किसी कॉलेज में वर्ष 2000 से वर्ष 2004 तक प्रति वर्ष भर्ती हुए और उर्तीण हुए छात्रों की संख्या (हजार में) दर्शायी गई है। आकृति का अध्ययन कर प्रश्नों के उत्तर दीजिए :
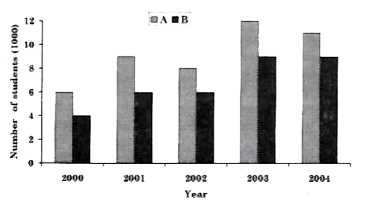
In which of the two years, the pass percentage of students was between 60 to 70 ?
कौन-से दो वर्षों में छात्रों का उत्तीर्ण प्रतिशत 60 से 70 के बीच थी?
View Solution