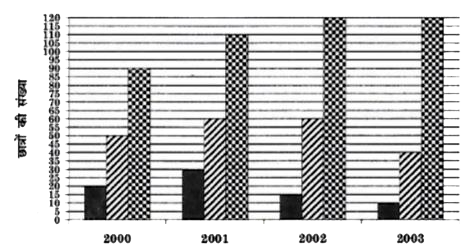
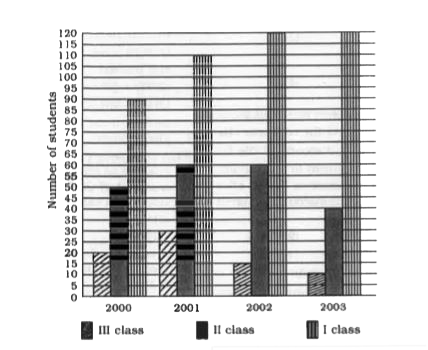
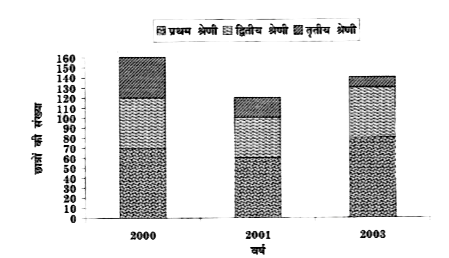
The graph shows the result of 10th class students of a school for 4 years. Study the graph and answer the questions:
The number of students appeared for the 10th class exam in the year 2002 is.
निम्नलिखित दण्ड आरेख 10 वीं कक्षा के छात्रों का 4 वर्ष का परीक्षा परिणाम दर्शाता है। आरेख का अध्ययन कीजिए और निम्नलिखित प्रश्नों का उत्तर दीजिए : छात्रों की संख्या
वर्ष 2002 में 10 वीं कक्षा की परीक्षा में शामिल छात्रों की संख्या बताइए:
180
195
200
120
The correct Answer is:B
अभीष्ट संख्या =15+60+120=195
Similar Questions
The graph shows the result of 10th class students of a school for 4 years. Study the graph and answer the questions :
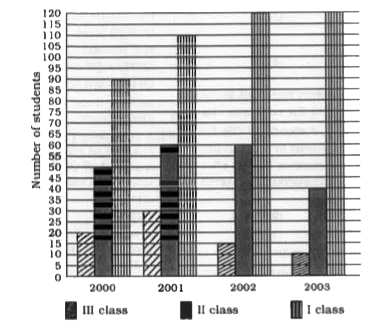
The number of students appeared for the 10th calss examin the year 2002 is
View SolutionThe graph shows the result of 10th class students of a school for 4 years. Study the graph and answer the questions :
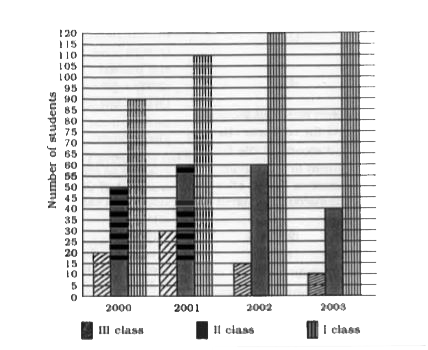
The year in which the maximum number of students appeared for the 10th class exam is
View SolutionThe graph shows the result of 10th class students of a school for 4 years. Study the graph and answer the questions :
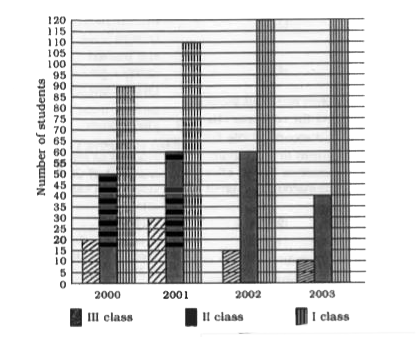
The ratio of students who scored seconds class to the total students appcarcd in the year 2000 is
View SolutionThe graph shows the result of 10th class students of a school for 4 years. Study the graph and answer the questions :
The percentage increase of first class in the year 2003 over the year 2002 is approximately
View Solutionनिम्नलिखित प्रश्नों के उत्तर दीजिए-
1857 की तोप का क्या आशय है?
View SolutionThe sub divided bar diagram given below depicts the result of Class XII students of a school for three years. Study the diagram and answer the questions given below :
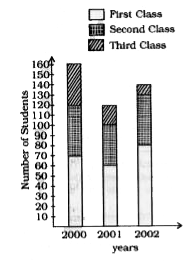
The number of students passed with Third class in th year 2002 is
View SolutionThe sub divided bar diagram given below depicts the result of Class XII students of a school for three years. Study the diagram and answer the questions given below :
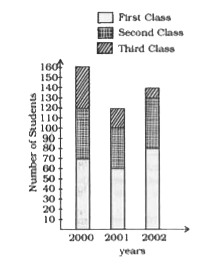
The number of students passed with Second class in th year 2002 is
View SolutionThe sub divided bar diagram given below depicts the result of class XII students of a school for three years. Study the diagram and answer the questions given below.
निम्नलिखित दण्ड आरेख तीन वर्षों के लिए एक स्कूल के कक्षा XII के छात्रों का परीक्षा परिणाम दिखाता है। दण्ड आरेख का अध्ययन कीजिए और निम्नलिखित प्रश्नों का उत्तर दीजिए :
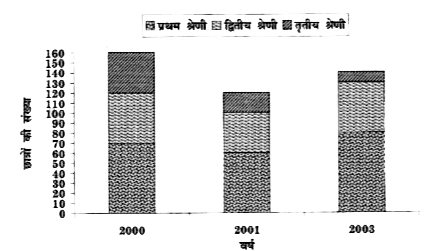
The number of students passed with Third class in the year 2002 is.
वर्ष 2002 में तृतीय श्रेणी में उत्तीर्ण छात्रों की संख्या है
View SolutionThe sub divided bar diagram given below depicts the result of class XII students of a school for three years. Study the diagram and answer the questions given below.
निम्नलिखित दण्ड आरेख तीन वर्षों के लिए एक स्कूल के कक्षा XII के छात्रों का परीक्षा परिणाम दिखाता है। दण्ड आरेख का अध्ययन कीजिए और निम्नलिखित प्रश्नों का उत्तर दीजिए :
The number of students passed with Second class in the year 2002 is.
वर्ष 2002 में द्वितीय श्रेणी में उत्तीर्ण छात्रों की संख्या है
View SolutionThe sub divided bar diagram given below depicts the result of class XII students of a school for three years. Study the diagram and answer the questions given below.
निम्नलिखित दण्ड आरेख तीन वर्षों के लिए एक स्कूल के कक्षा XII के छात्रों का परीक्षा परिणाम दिखाता है। दण्ड आरेख का अध्ययन कीजिए और निम्नलिखित प्रश्नों का उत्तर दीजिए :
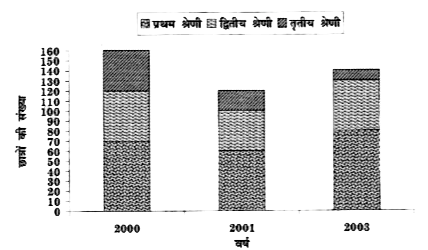
The percentage of students passed with Second class in the year 2000 is
वर्ष 2000 में द्वितीय श्रेणी में उत्तीर्ण हुए छात्रों का प्रतिशत है:
View Solution
