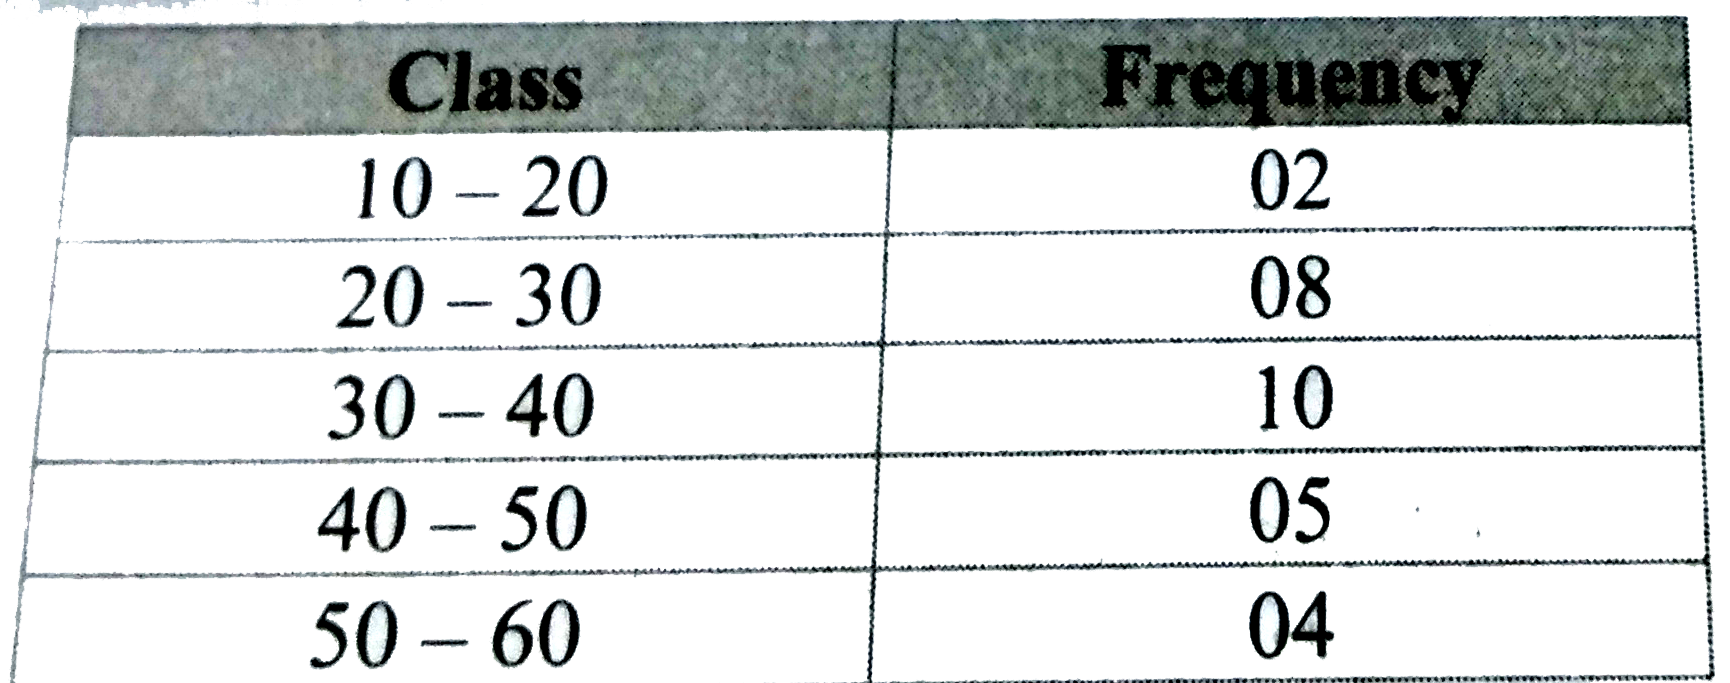
For drawing a frequency polygon of a continuous frequency distribution, we plot the points whose ordinates are the frequencies of the respecitve classes and abscissae are, respectively
upper limits of the classes
lower limits of the classes
class marks of the classes
upper limits of preceding classes
The correct Answer is:C
Step by step video & text solution for For drawing a frequency polygon of a continuous frequency distribution, we plot the points whose ordinates are the frequencies of the respecitve classes and abscissae are, respectively by Maths experts to help you in doubts & scoring excellent marks in Class 9 exams.
Updated on:21/07/2023Topper's Solved these Questions
- STATISTICSBOOK - MTG IIT JEE FOUNDATIONCHAPTER - STATISTICSEXERCISE - Exercise (Match the following)
2 Videos
- STATISTICSBOOK - MTG IIT JEE FOUNDATIONCHAPTER - STATISTICSEXERCISE - Exercise (Assertion and Reason Type)
5 Videos
- STATISTICSBOOK - MTG IIT JEE FOUNDATIONCHAPTER - STATISTICSEXERCISE - NCERT SECTION (Exercise 14.4)
7 Videos
- QUADRILATERALS BOOK - MTG IIT JEE FOUNDATIONCHAPTER - QUADRILATERALS EXERCISE - Olympiad/HOTS CORNER
15 Videos
- TRIANGLESBOOK - MTG IIT JEE FOUNDATIONCHAPTER - TRIANGLESEXERCISE - OLYMPAID/ HOTS CORNER
10 Videos
Similar Questions
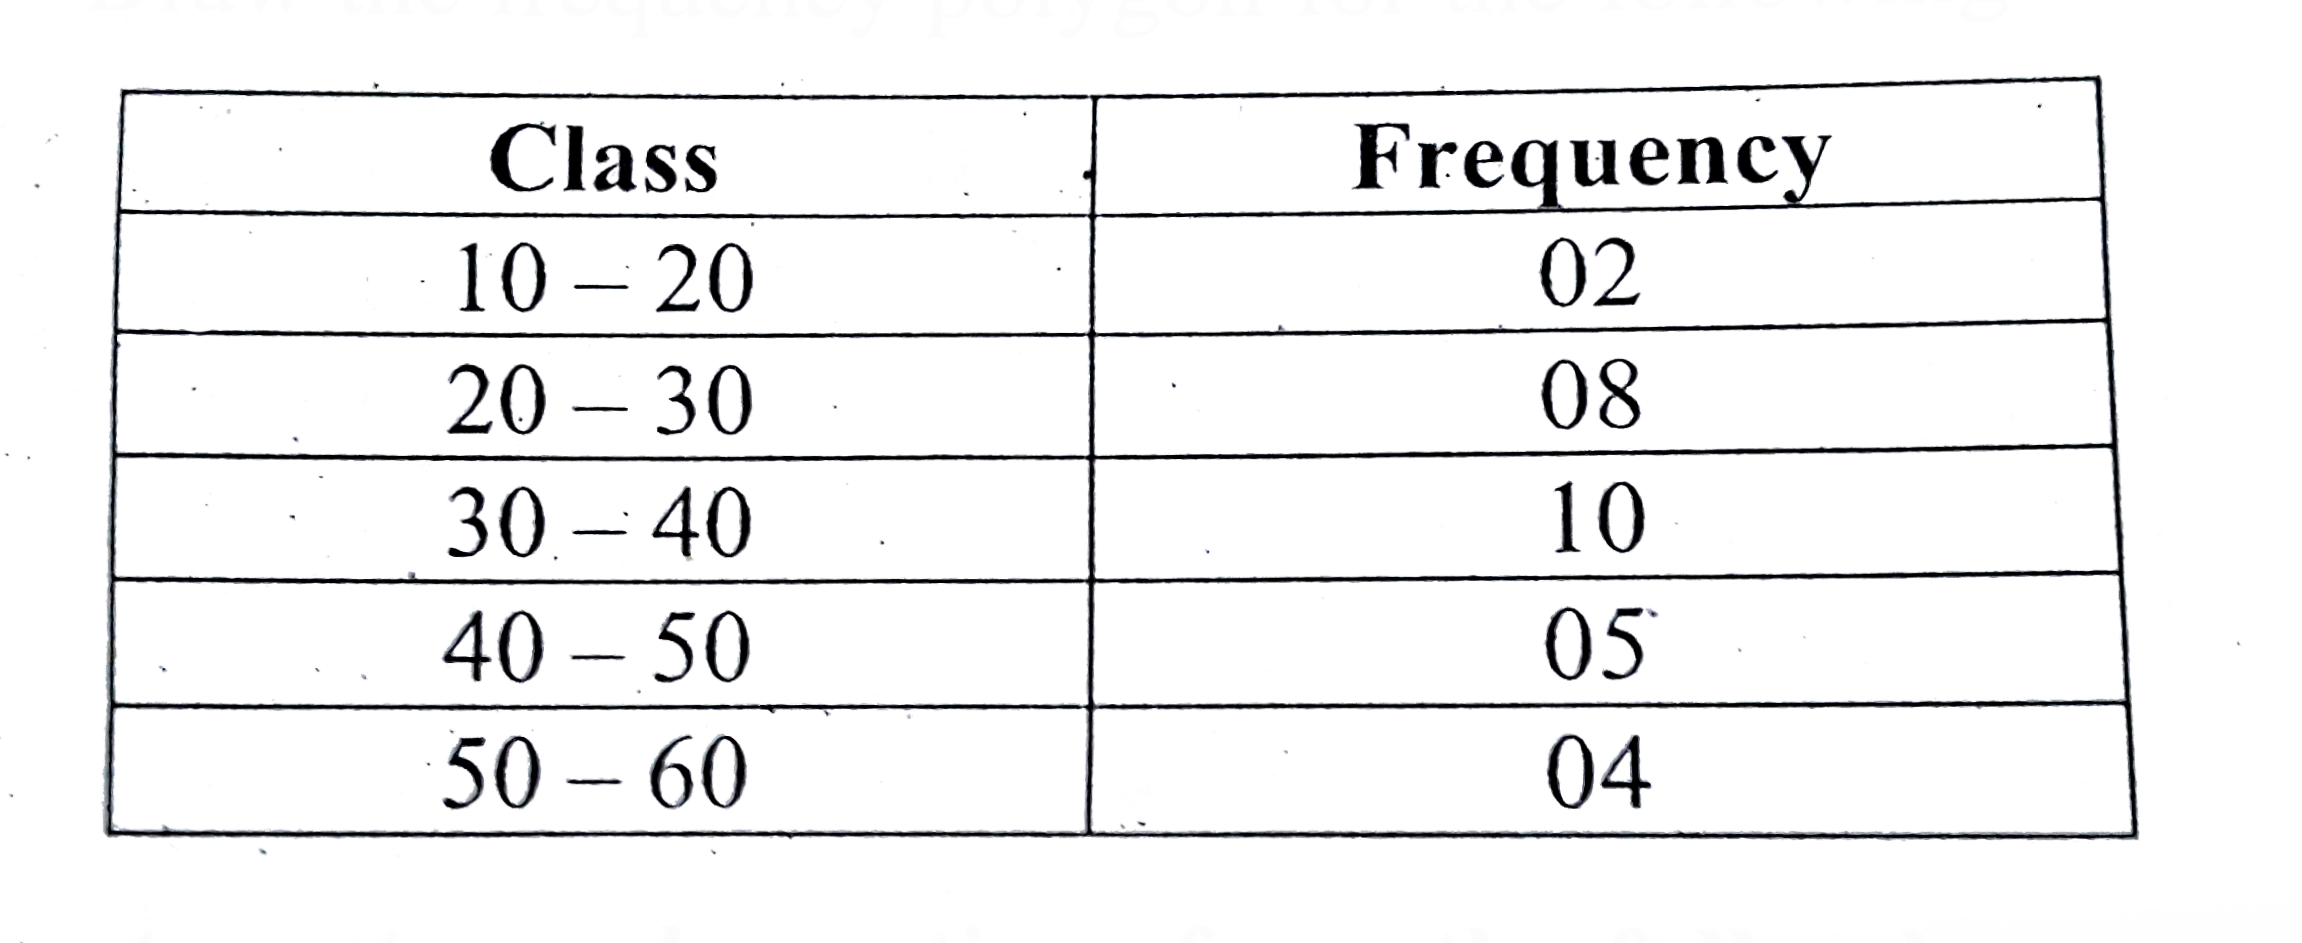
Draw a frequency polygon for the following frequency distribution:

View SolutionDraw a frequency polygon for the following frequency distribution.

View SolutionArithmetic mean of a continuous frequency distribution
View SolutionMedian of grouped or continuous frequency distribution
View SolutionDraw frequency polygon for the following frequency distribution.

View SolutionDraw the frequency polygon for the following frequency distribution:

View SolutionDraw a frequency polygon for the following grouped frequency distribution table :

View SolutionDrawing the histogram of a continuous grouped frequency distribution.
View SolutionDraw a frequency polygon for the following grouped frequency distrbution table.

View SolutionContinuous or grouped frequency distribution.
View Solution
