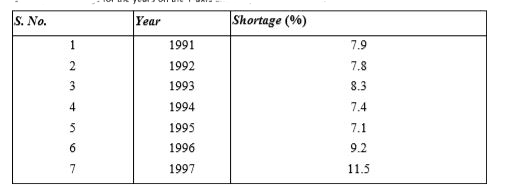
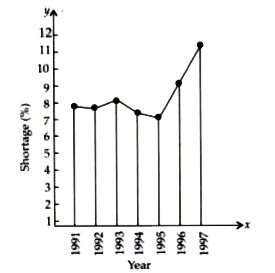
The following Table shows the total power shortage in India from 1991 - 1997. Show the data in the form of a graph. Plot shortage percentage for the years on the Y-axis and the year on the X-axis
Scale : Along x-axis : 1 unit = 1 year
Along y-axis : 1 unit = 1%
Topper's Solved these Questions
- COAL AND PETROLEUMBook:MTG IIT JEE FOUNDATIONChapter:COAL AND PETROLEUMExercise:EXERCISE (MULTIPLE CHOICE QUESTION) LEVEL 1
Explore 30 Videos
- COAL AND PETROLEUMBook:MTG IIT JEE FOUNDATIONChapter:COAL AND PETROLEUMExercise:EXERCISE (MULTIPLE CHOICE QUESTION) LEVEL 2
Explore 20 Videos
- COAL AND PETROLEUMBook:MTG IIT JEE FOUNDATIONChapter:COAL AND PETROLEUMExercise:SOLVED EXAMPLES
Explore 16 Videos
- ATOMS, MOLECULES AND ATOMIC STRUCTUREBook:MTG IIT JEE FOUNDATIONChapter:ATOMS, MOLECULES AND ATOMIC STRUCTUREExercise:EXERCISE ( Integer/Numerical Value Type)
Explore 5 Videos
- COMBUSTION AND FLAME Book:MTG IIT JEE FOUNDATIONChapter:COMBUSTION AND FLAME Exercise:OLYMPIAD/HOTS CORNER
Explore 15 Videos
Similar Questions
The following Table shows the total power shortage in India from 1991 - 1997. Show the data in the form of a graph. Plot shortage percentage for the years on the Y-axis and the year on the X-axis

View SolutionThe given table shows the quantity of petrol and its cost.

Plot a graph to show the data.
View Solution
Knowledge Check
A graph is plotted taking ∘––C along the Y - axis and of along the X - axis .It is a /an
AparabolaBstraight lineCellipseDcircleA graph is plotted taking .∘C along the Y-axis and .∘F along the X-axis. It is a/an
AparabolaBstraight lineCellipseDcircleIf the momentum of a particle is plotted on X−axis and its kinetic energy on the Y−axis, the graph is a
Astraight lineBparabolaCrectangular hyperbolaDcircle
. The following data shows the year wise strength of a school.Represent the the above data by bar graph:
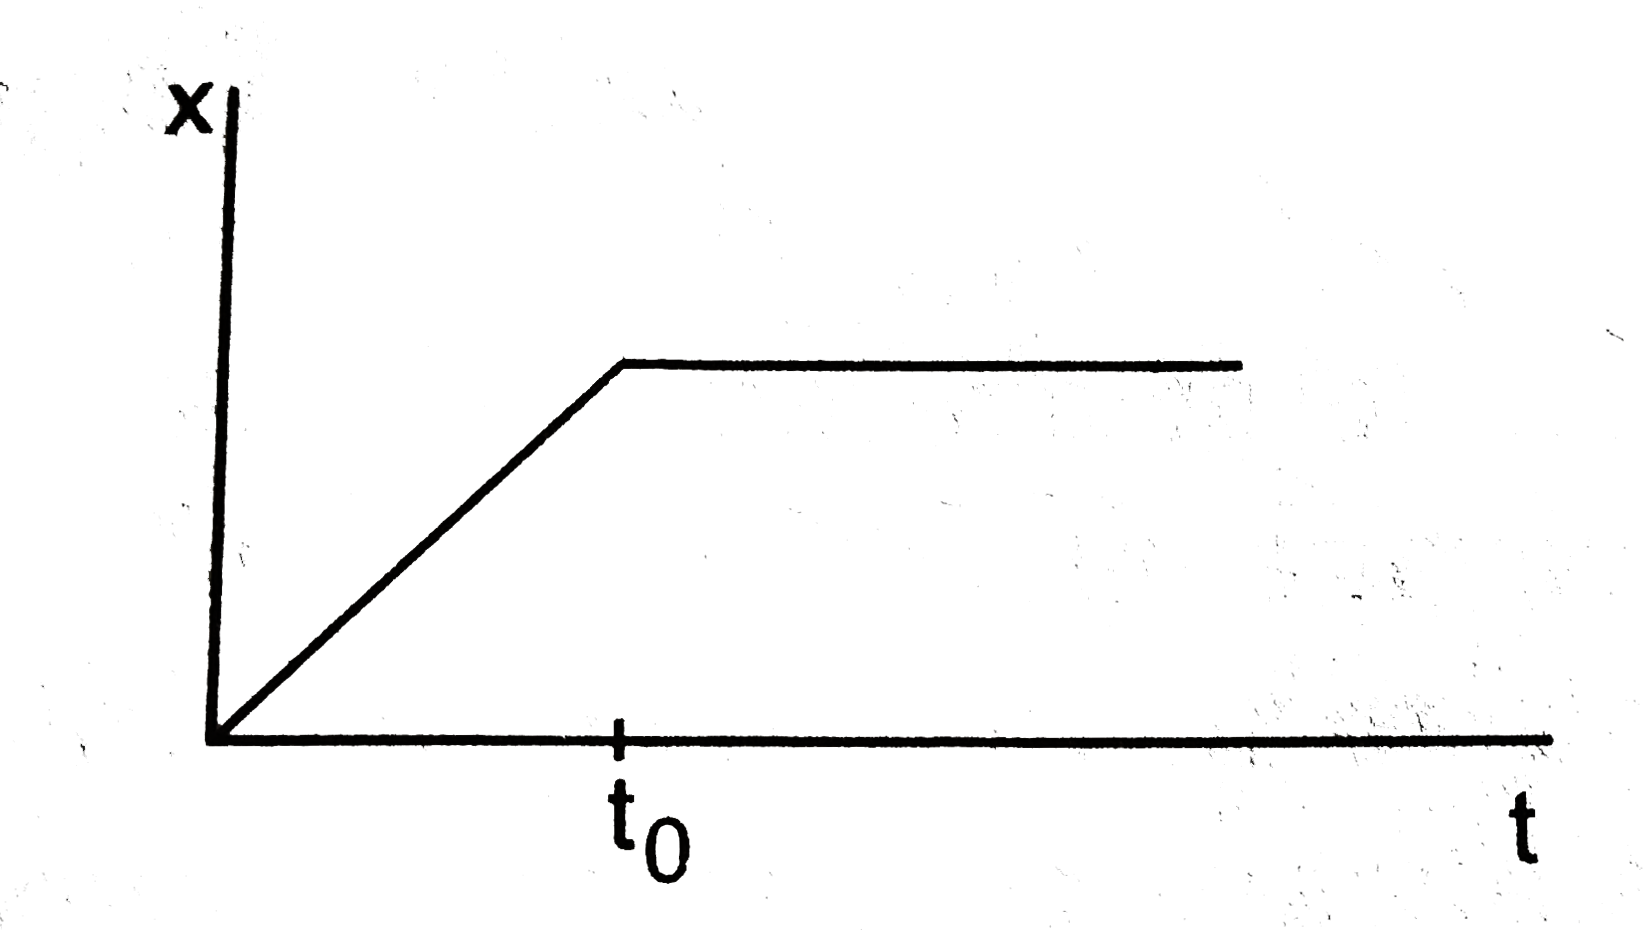
View SolutionFigure shows the displacement time graph of a particle moving on the X-axis
View SolutionThe line graph shows the production of product A and B during the period 2004 to 2009 and the second line graph shows the percentage sale of these products
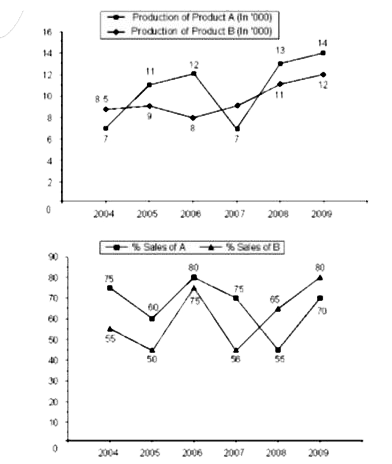
In the given line graph, what is the total sale of products A and B in the year 2007
View SolutionThe following graph shows the sales of cars (in thousands) in four cities in 4 years. Study the graph and answer the question.
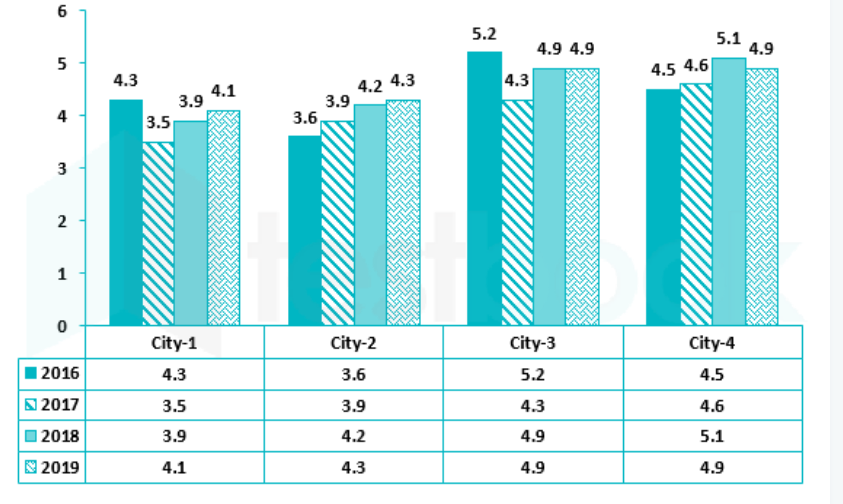
Which city has the highest percentage of sales, and in which year?
View SolutionThe following graph shows the profit ( in crore ₹) earned by a company in the years from 2012 to 2019.
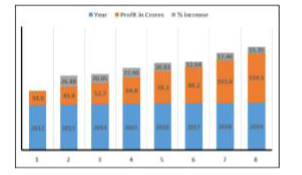
The percentage increased in the profit from the previous year , is greatest in the year :
View Solution
