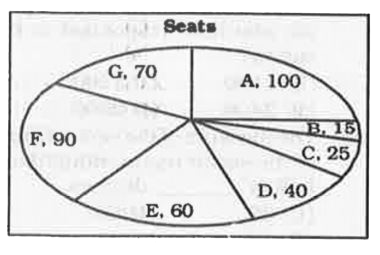
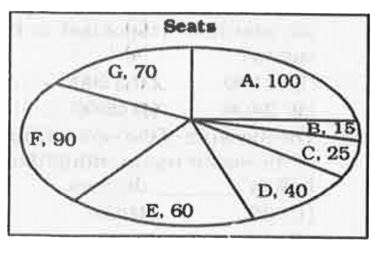
The pie chart graphs shows the number of seats that each party has in the lower house of the parliament. Study the diagram and answer the following questions.
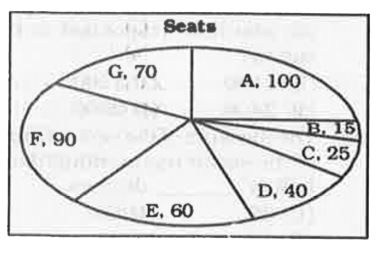
If the data shows the seats of all the parties then the lower house of parliament has how many seats in total?
400
300
450
360
The correct Answer is:A
Step by step video, text & image solution for The pie chart graphs shows the number of seats that each party has in the lower house of the parliament. Study the diagram and answer the following questions. If the data shows the seats of all the parties then the lower house of parliament has how many seats in total? by Maths experts to help you in doubts & scoring excellent marks in Class 14 exams.
Updated on:21/07/2023Topper's Solved these Questions
- STATISTICS AND DATA INTERPRETATIONBOOK - KIRAN PUBLICATIONCHAPTER - STATISTICS AND DATA INTERPRETATIONEXERCISE - TYPE-VIII
8 Videos
- STATISTICS AND DATA INTERPRETATIONBOOK - KIRAN PUBLICATIONCHAPTER - STATISTICS AND DATA INTERPRETATIONEXERCISE - TYPE-VI
86 Videos
- SIMPLIFICATIONBOOK - KIRAN PUBLICATIONCHAPTER - SIMPLIFICATIONEXERCISE - TEST YOURSELF
25 Videos
- TIME AND DISTANCEBOOK - KIRAN PUBLICATIONCHAPTER - TIME AND DISTANCEEXERCISE - Type -XI
74 Videos
Similar Questions
The pie chart shows the number of leopards in all the leopard wild life sanctuaries in the country. Study the diagram and answer the following question.
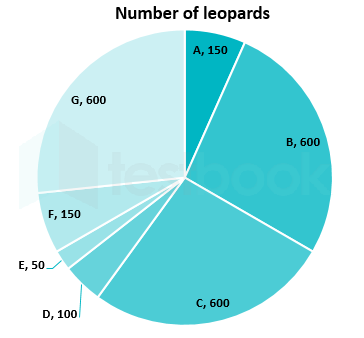
What is the total number of leopards in these sanctuaries?
View SolutionThe bar graph shows the number of soldiers in the armies of different countries. Study the diagram and answer the following questions.
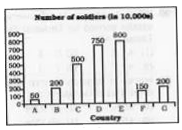
Which country has the least number of soldiers?
View Solution
Knowledge Check
The pie chart graphs shows the number of seats that each party has in the lower house of the parliament. Study the diagram and answer the following questions.
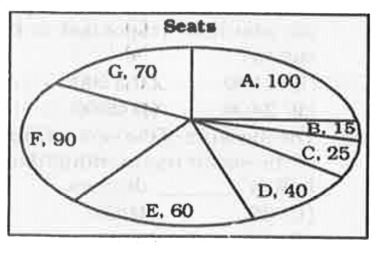
Which party has the second highest seats?AFBGCADDThe pie chart graphs shows the number of seats that each party has in the lower house of the parliament. Study the diagram and answer the following questions.
The measure of the central angle of the sector representing number of seats of party F is ____ degrees.A60B90C81D100The pie chart graphs shows the number of seats that each party has in the lower house of the parliament. Study the diagram and answer the following questions.
If parties D, E and F form a coalition they would be still short of how many seats to reach the half way mark?A20B15C10D25
The pie chart shows the number of tigers in all the tiger wild life santuaries in the country. Study the diagram and answer the following questions.
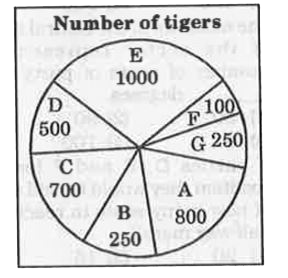
What is the total number of tigers in these santuaries?
View SolutionThe pie chart shows the number of tigers in all the tiger wild life santuaries in the country. Study the diagram and answer the following questions.

What is the total number of tigers in these santuaries?
View SolutionThe pie chart shows the number of elephants in all the elephant wild life sanctuaries in the country. Study the diagram and answer the following questions.
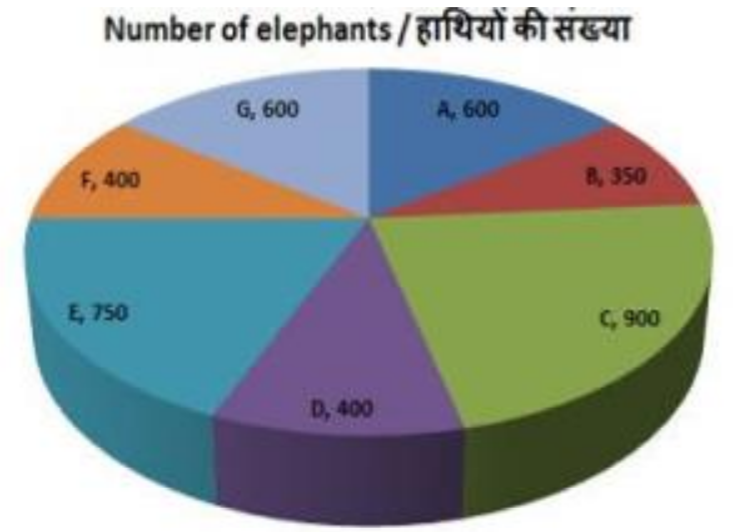
What is the total number of elephants in these sanctuaries?
View SolutionThe pie chart shows the number of elephants in all the elephant wild life sanctuaries in the country. Study the diagram and answer the following questions.

What is the total number of elephants in these sanctuaries?
View SolutionThe pie chart shows the breakup of expenditure of a college for the year 2017. Study the diagram and answer the following questions.
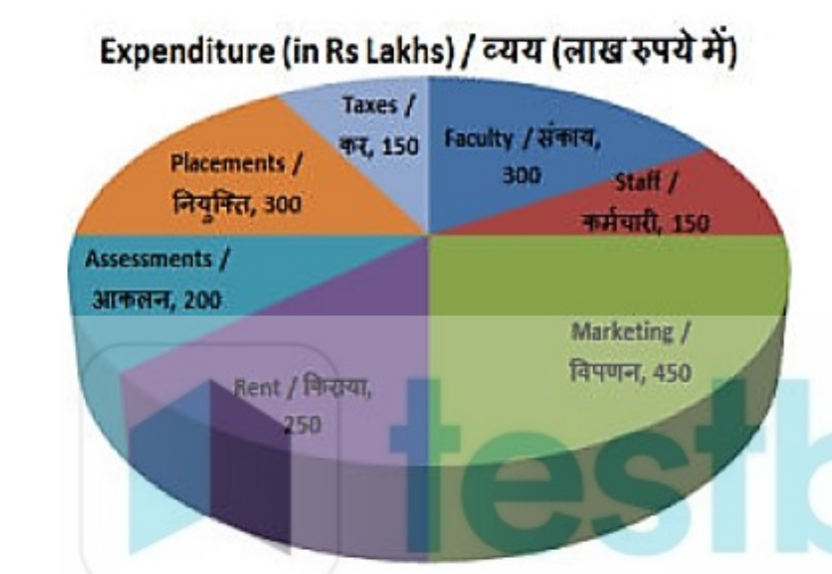
What is the total expenditure (in Rs lakhs)?
View Solution
