The pie chart shows the distribution of wealth among 7 children according to their father's will. Study the diagram and answer the following questions.
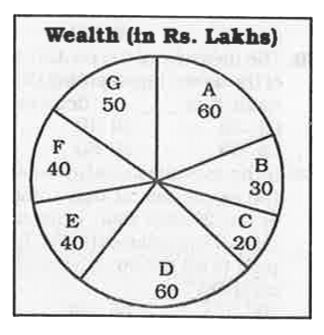
If 40% bwealth tax has to be paid on the wealth that each child receives, how much wealth tax (in Rs. lakhs) does C have to pay?
8
10
12
4
The correct Answer is:A
Step by step video, text & image solution for The pie chart shows the distribution of wealth among 7 children according to their father's will. Study the diagram and answer the following questions. If 40% bwealth tax has to be paid on the wealth that each child receives, how much wealth tax (in Rs. lakhs) does C have to pay? by Maths experts to help you in doubts & scoring excellent marks in Class 14 exams.
Updated on:21/07/2023Topper's Solved these Questions
- STATISTICS AND DATA INTERPRETATIONBOOK - KIRAN PUBLICATIONCHAPTER - STATISTICS AND DATA INTERPRETATIONEXERCISE - TYPE-VIII
8 Videos
- STATISTICS AND DATA INTERPRETATIONBOOK - KIRAN PUBLICATIONCHAPTER - STATISTICS AND DATA INTERPRETATIONEXERCISE - TYPE-VI
86 Videos
- SIMPLIFICATIONBOOK - KIRAN PUBLICATIONCHAPTER - SIMPLIFICATIONEXERCISE - TEST YOURSELF
25 Videos
- TIME AND DISTANCEBOOK - KIRAN PUBLICATIONCHAPTER - TIME AND DISTANCEEXERCISE - Type -XI
74 Videos
Similar Questions
The pie chart shows the breakup of expenditure of a college for the year 2017. Study the diagram and answer the following questions.
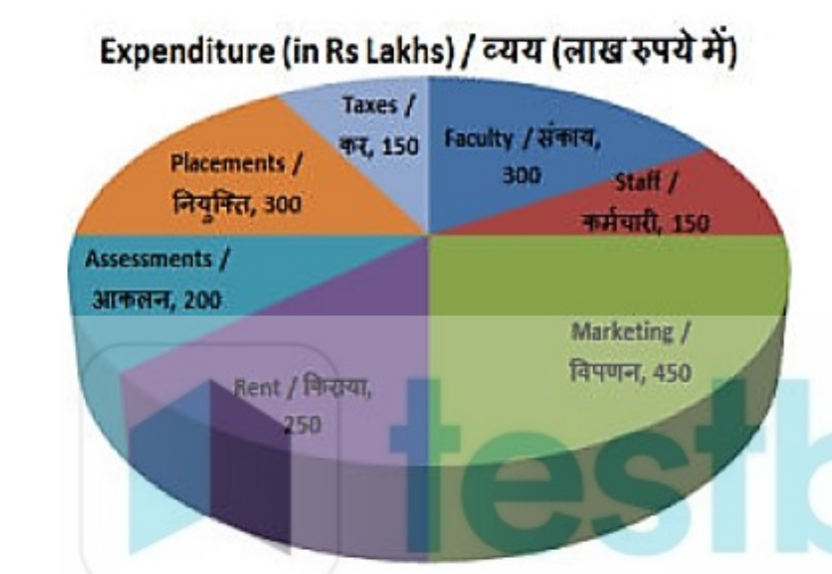
What is the total expenditure (in Rs lakhs)?
View SolutionThe pie chart shows the breakup of expendoture of a manufacturing company for the year 2017. Study the diagram and answer the following questions.
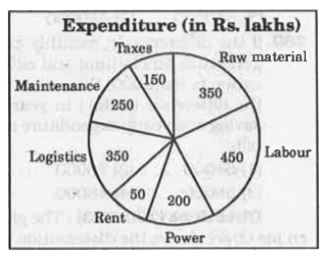
What is the total expenditure (in Rs. lakhs)?
View Solution
Knowledge Check
The pie chart shows the distribution of wealth among 7 children according to their father's will. Study the diagram and answer the following questions.
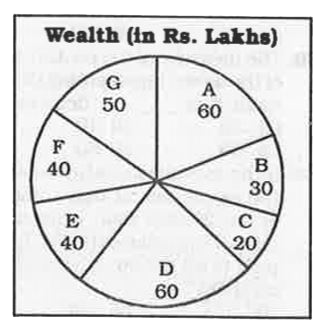
Which child got the least share of wealth according to the will?ACBBCDDEThe pie chart shows the distribution of wealth among 7 children according to their father's will. Study the diagram and answer the following questions.
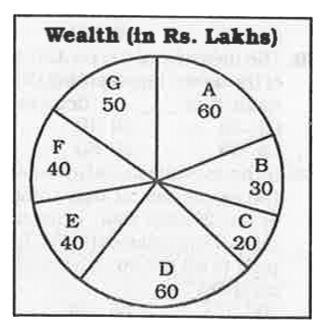
What is the total wealth (in Rs. lakhs) of the father which was distributed according to the will?A300B400C360D240The pie chart shows the distribution of wealth among 7 children according to their father's will. Study the diagram and answer the following questions.
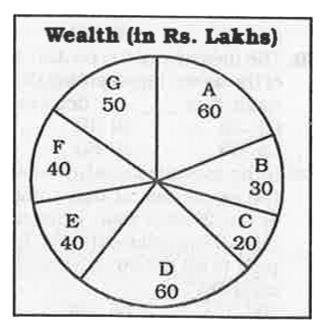
The measure of central angle of the sector representing the share of wealth that D gets is ____ degrees.A72B60C50D75
The pie chart shows the breakup of expenditure of a software company for the year 2017. Study the diagram and answer the following questions.
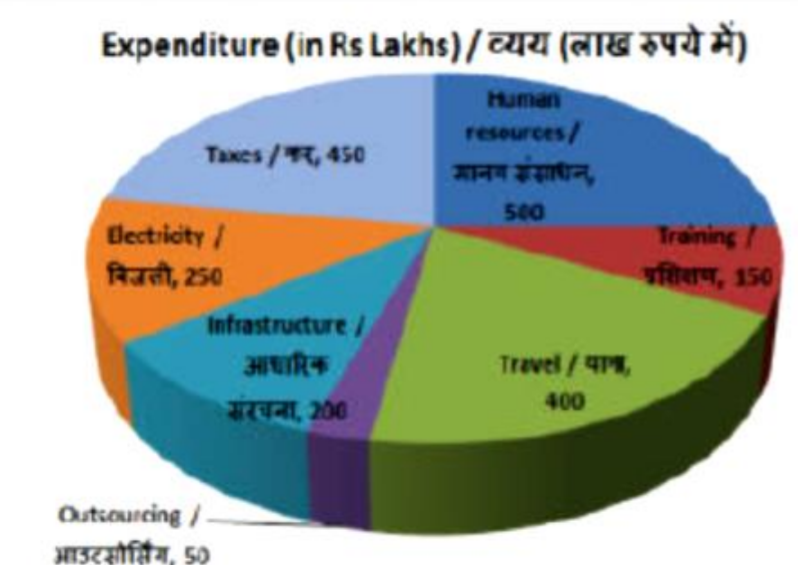
What is the total expenditure (in Rs lakhs)?
View SolutionThe pie chart shows the breakup of expenditure of a mining company for the year 2017. Study the diagram and answer the following questions.
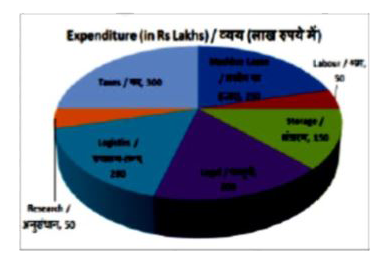
What is the total expenditure (in Rs lakhs)?
View SolutionThe pie chart graphs shows the number of seats that each party has in the lower house of the parliament. Study the diagram and answer the following questions.
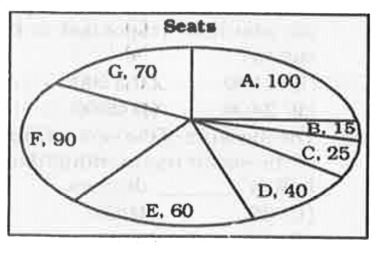
Which party has the second highest seats?
View SolutionThe pie chart shows the breakup of expenditure of a manufacturing company for the year 2017. Study the diagram and answer the following questions.
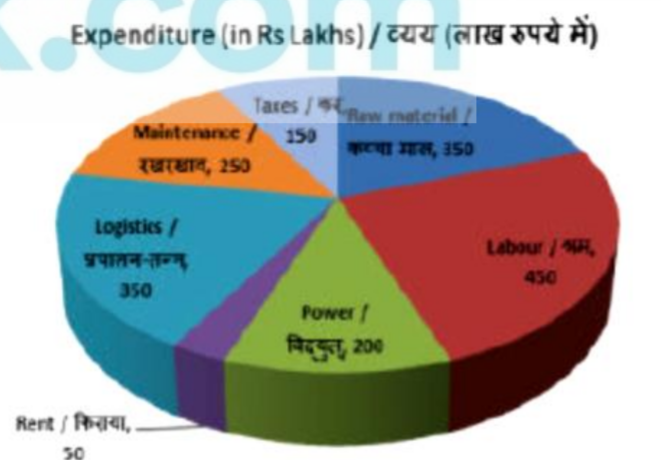
What is the total expenditure (in Rs lakhs)?
View SolutionThe pie chart shows the breakup of expendoture of a software company for the year 2017. Study the diagram and answer the following questions.
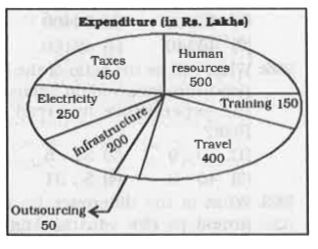
What is the total expenditure (in Rs. lakhs)?
View Solution
