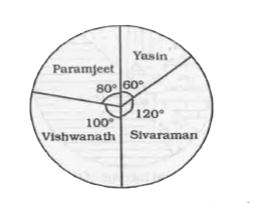
The pie chart, given here, represents the number of valid votes obtained by four students who contested election for school leadership. The total number of valid votes polled was 720.
Observe the chart and answer the questions based on it.
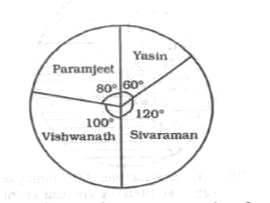
What was the minimum number of votes obtained by any candidate ?
100
110
120
130
The correct Answer is:C
Step by step video, text & image solution for The pie chart, given here, represents the number of valid votes obtained by four students who contested election for school leadership. The total number of valid votes polled was 720. Observe the chart and answer the questions based on it. What was the minimum number of votes obtained by any candidate ? by Maths experts to help you in doubts & scoring excellent marks in Class 14 exams.
Updated on:21/07/2023Topper's Solved these Questions
- STATISTICS AND DATA INTERPRETATIONBOOK - KIRAN PUBLICATIONCHAPTER - STATISTICS AND DATA INTERPRETATIONEXERCISE - TYPE-VIII
8 Videos
- STATISTICS AND DATA INTERPRETATIONBOOK - KIRAN PUBLICATIONCHAPTER - STATISTICS AND DATA INTERPRETATIONEXERCISE - TYPE-VI
86 Videos
- SIMPLIFICATIONBOOK - KIRAN PUBLICATIONCHAPTER - SIMPLIFICATIONEXERCISE - TEST YOURSELF
25 Videos
- TIME AND DISTANCEBOOK - KIRAN PUBLICATIONCHAPTER - TIME AND DISTANCEEXERCISE - Type -XI
74 Videos
Similar Questions
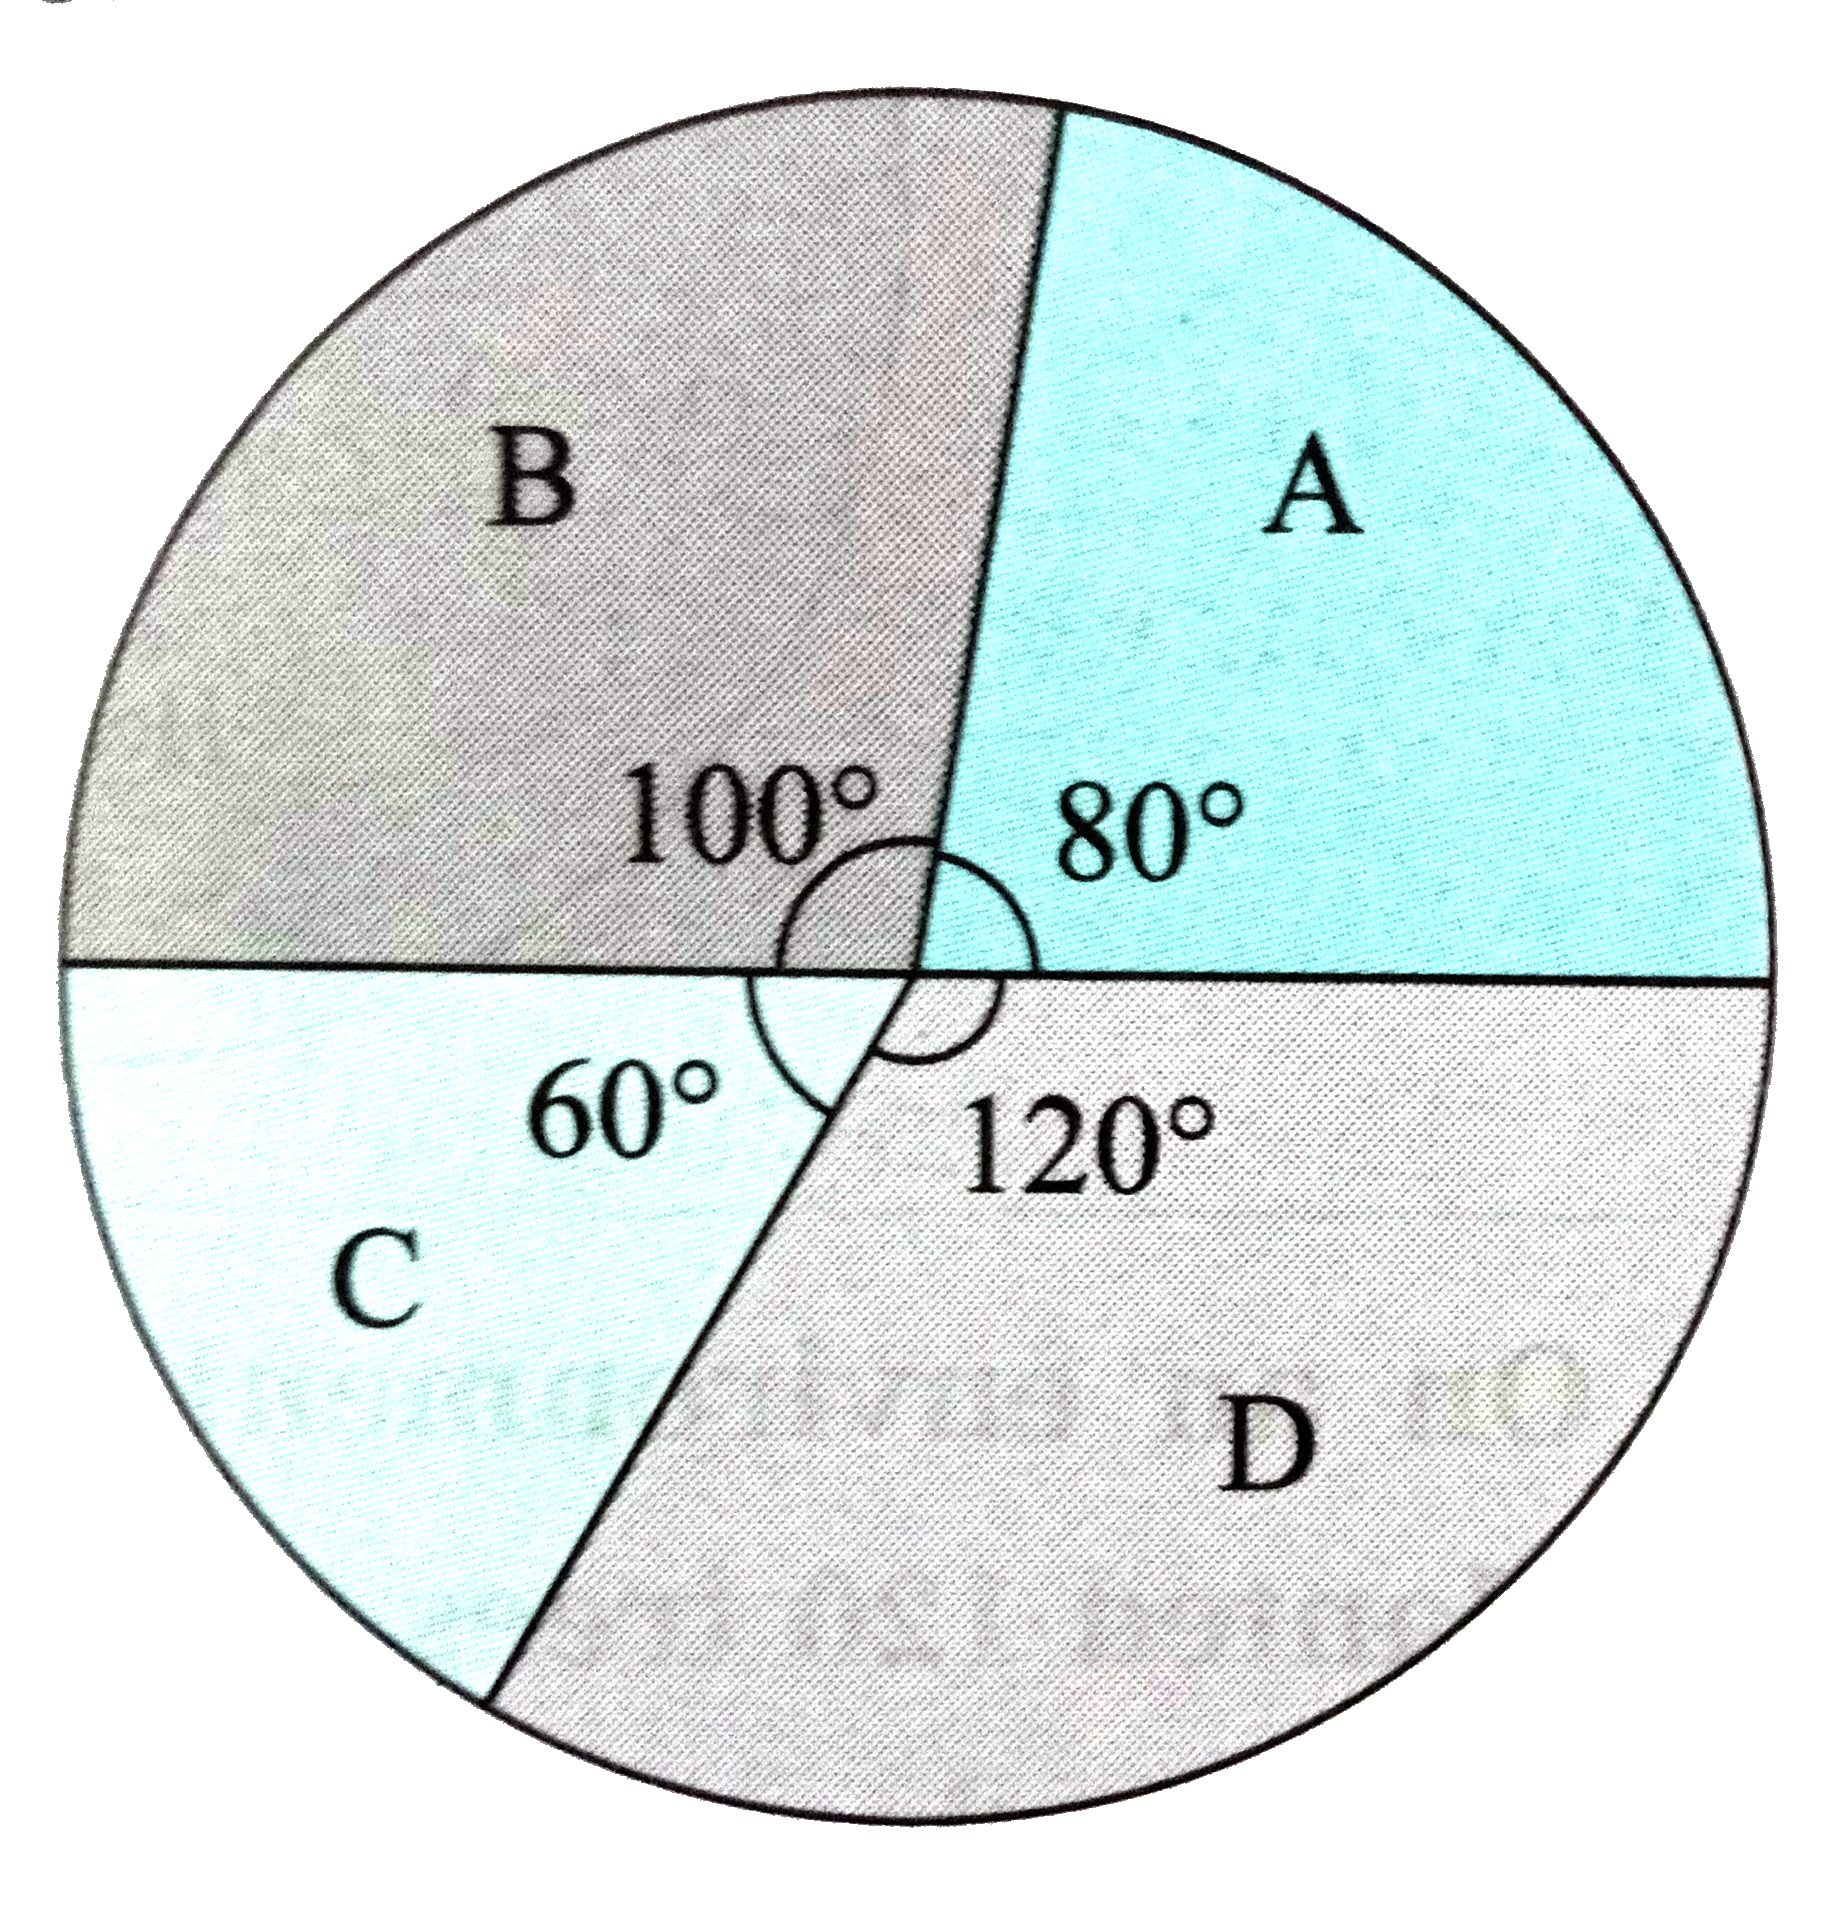
The pie diagram represents the number of valid votes secured by four students who contested for school captain.The total number of valid votes polled was 720.
Answer the following questions :
(i) Who has won the election ?
(ii) How many votes died the winner secure ?
(iii) What is the minimum number of votes ?Who got it ?
(iv) By how many votes did the winner defeat the nearest contestant ?
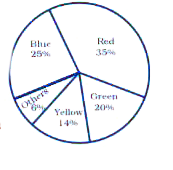
View SolutionObserve the pie chart given below and answer questions based on it.
Which colour received 15 of the votes?
View Solution
Knowledge Check
The pie chart, given here, represents the number of valid votes obtained by four students who contested election for school leadership. The total number of valid votes polled was 720.
Observe the chart and answer the questions based on it.
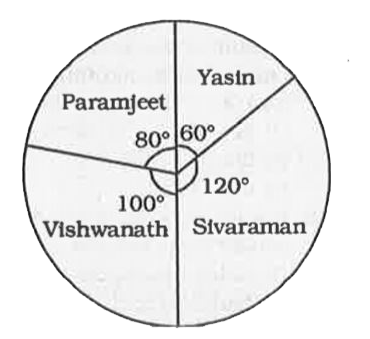
What was the winner ?ASivaramanBParamjeetCYasinDVishwanathThe pie chart, given here, represents the number of valid votes obtained by four students who contested election for school leadership. The total number of valid votes polled was 720.
Observe the chart and answer the questions based on it.
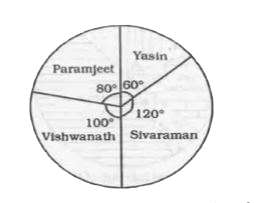
Who was the winner ?ASivaramanBParamjeetCYasinDVishwanathThe pie chart, given here, represents the number of valid votes obtained by four students who contested election for school leadership. The total number of valid votes polled was 720.
Observe the chart and answer the questions based on it.
By how many votes did the winner defeat his nearest rival ?A40B45C48D50
The pie-chart given below shows the number of students enrolled in a school in different activities. Total number of students in the school is 1200. Study the chart and answer the questions.

Which two clubs have the enrolment in the ratio of 2:1 ?
View SolutionThe pie-chart given below shows the number of students enrolled in a school in different activities. Total number of students in the school is 1200. Study the chart and answer the questions.

How many students are enrolled in N.C.C. activities ?
View SolutionThe pie-chart given below shows the number of students enrolled in a school in different activities. Total number of students in the school is 1200. Study the chart and answer the questions.

What is the total number of students enrolled in Debating Club and HRD Club ?
View SolutionThe pie-chart given below shows the number of students enrolled in a school in different activities. Total number of students in the school is 1200. Study the chart and answer the questions.

What is the ratio of number of students enrolled in Scout and Redcross activities together to those enrolled in Debating Club activities ?
View SolutionThe pie chart, given here, represents the number of valid votes obtained by four students who contested election for school leadership. The total number of valid votes polled was 720.
Observe the chart and answer the questions based on it.
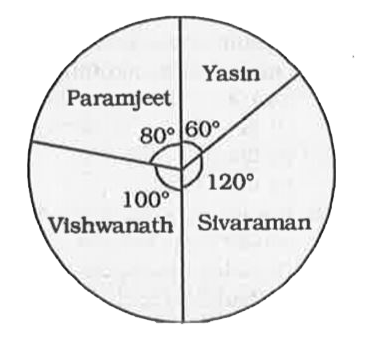
By how many votes did the winner defeat his nearest rival ?
View Solution
