The pie-chart given here shows expenditures incurred by a family on various items and their savings, which amounts to Rs 8,000 in a month.
Study the chart and answer the questions based on the pie-chart
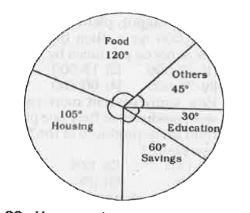
What is the total expenditure of the family for the month ?
Rs 40,000
Rs 48,000
Rs 45,000
Rs 50,000
The correct Answer is:A
Step by step video, text & image solution for The pie-chart given here shows expenditures incurred by a family on various items and their savings, which amounts to Rs 8,000 in a month. Study the chart and answer the questions based on the pie-chart What is the total expenditure of the family for the month ? by Maths experts to help you in doubts & scoring excellent marks in Class 14 exams.
Updated on:21/07/2023Topper's Solved these Questions
- STATISTICS AND DATA INTERPRETATIONBOOK - KIRAN PUBLICATIONCHAPTER - STATISTICS AND DATA INTERPRETATIONEXERCISE - TYPE-VIII
8 Videos
- STATISTICS AND DATA INTERPRETATIONBOOK - KIRAN PUBLICATIONCHAPTER - STATISTICS AND DATA INTERPRETATIONEXERCISE - TYPE-VI
86 Videos
- SIMPLIFICATIONBOOK - KIRAN PUBLICATIONCHAPTER - SIMPLIFICATIONEXERCISE - TEST YOURSELF
25 Videos
- TIME AND DISTANCEBOOK - KIRAN PUBLICATIONCHAPTER - TIME AND DISTANCEEXERCISE - Type -XI
74 Videos
Similar Questions
The pie-chart given here shows expenditures incurred by a family on various items and their savings, which amounts to Rs 8,000 in a month.
Study the chart and answer the questions based on the pie-chart
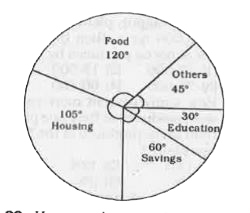
How much more amount is spent on food than on housing ?
View SolutionIn the given pie chart what is the total expenditure on rent
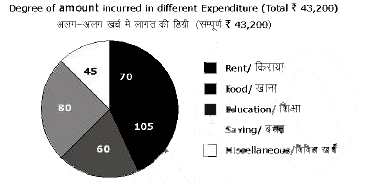
View Solution
Knowledge Check
Directions : The pie-chart given below shows expenditure incurred by a family on various items and their savings. Study the chart and answer the questions based on the pie-chart
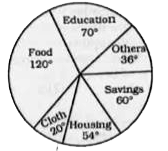
The ratio of expenditure on food to saving is :A3:2B2:1C4:3D3:4The pie-chart given here shows expenditures incurred by a family on various items and their savings, which amounts to Rs 8,000 in a month.
Study the chart and answer the questions based on the pie-chart
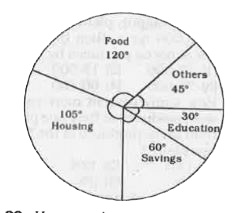
How much expenditure is incurred on education ?A(a) Rs 3,000B(b) Rs 5,000C(c) Rs 4,000D(d) Rs 7,000Study the chart and answer the question based, on the pie chart.
The pie chart given below shows expenditures incurred by a family on various items and savings in a
month. Savings of the family is ₹ 8,000 in a month.
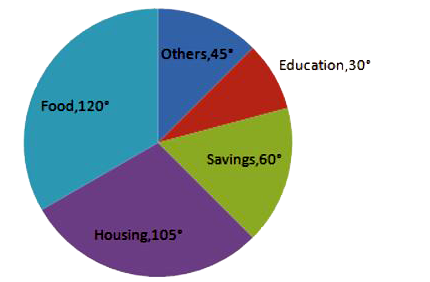
What is the total expenditure of the family for the month ?A₹45,000B₹48,000C₹50,000D₹40,000
Directions : The pie-chart given below shows expenditure incurred by a family on various items and their savings. Study the chart and answer the questions based on the pie-chart

The ratio of expenditure on food to saving is :
View SolutionDirections : The pie-chart given below shows expenditure incurred by a family on various items and their savings. Study the chart and answer the questions based on the pie-chart
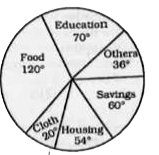
If the monthly income is Rs. 36000, then the yearly saving is :
View SolutionDirections : The pie-chart given below shows expenditure incurred by a family on various items and their savings. Study the chart and answer the questions based on the pie-chart
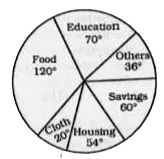
If the expenditure on education is Rs. 1600 more than that on housing , then the expenditure onj food is :
View SolutionDirection: The pie-chart given hereshows expenditures incurred by a family on various items and their savings,which amount to ? 8000 in a month.
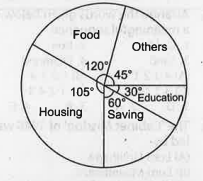
The ratio of the expenditure on food to the savings is
(A) 3:2 (B) 2:1 (C) 4:3 (D) 3:4
View SolutionStudy the chart and answer the question based, on the pie chart.
The pie chart given below shows expenditures incurred by a family on various items and savings in a month. Savings of the family is ₹ 8,000 in a month.
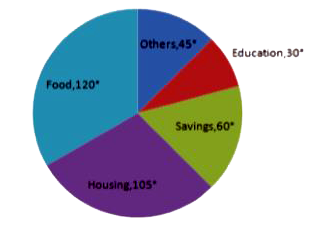 The ratio of the expenditure on food to the saving is :
View Solution
