The graph given below the daily income of 50 workers in a factory. Study the graph and answer the questions.
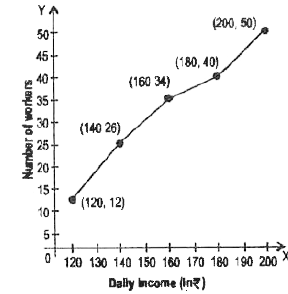
The median wages in the factory is
Rs 140
Rs 138
Rs 150
Rs 160
The correct Answer is:D
Step by step video, text & image solution for The graph given below the daily income of 50 workers in a factory. Study the graph and answer the questions. The median wages in the factory is by Maths experts to help you in doubts & scoring excellent marks in Class 14 exams.
Updated on:21/07/2023Topper's Solved these Questions
- STATISTICS AND DATA INTERPRETATIONBOOK - KIRAN PUBLICATIONCHAPTER - STATISTICS AND DATA INTERPRETATIONEXERCISE - TYPE-VII
363 Videos
- STATISTICS AND DATA INTERPRETATIONBOOK - KIRAN PUBLICATIONCHAPTER - STATISTICS AND DATA INTERPRETATIONEXERCISE - TYPE-VIII
8 Videos
- STATISTICS AND DATA INTERPRETATIONBOOK - KIRAN PUBLICATIONCHAPTER - STATISTICS AND DATA INTERPRETATIONEXERCISE - TYPE-V
38 Videos
- SIMPLIFICATIONBOOK - KIRAN PUBLICATIONCHAPTER - SIMPLIFICATIONEXERCISE - TEST YOURSELF
25 Videos
- TIME AND DISTANCEBOOK - KIRAN PUBLICATIONCHAPTER - TIME AND DISTANCEEXERCISE - Type -XI
74 Videos
Similar Questions
The graph shows Income and Expenditure of a company. Study the graph and answer the questions.
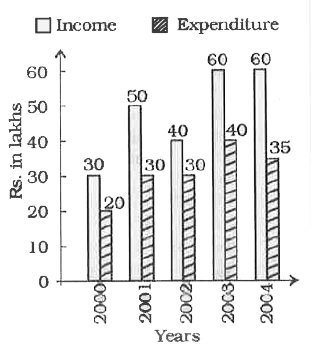
The number of years in which the income exceeds the average income is
View SolutionThe graph shows Income and Expenditure of a company. Study the graph and answer the questions.
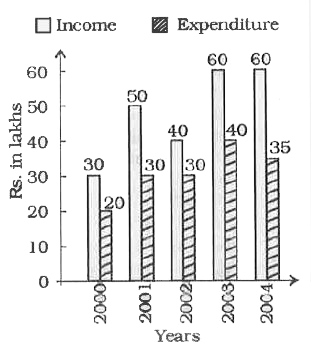
The income in 2002 was equal to the expenditure in the year
View Solution
Knowledge Check
The graph given below shows the daily income of 50 workers in a factory Study the graph and answer the questions
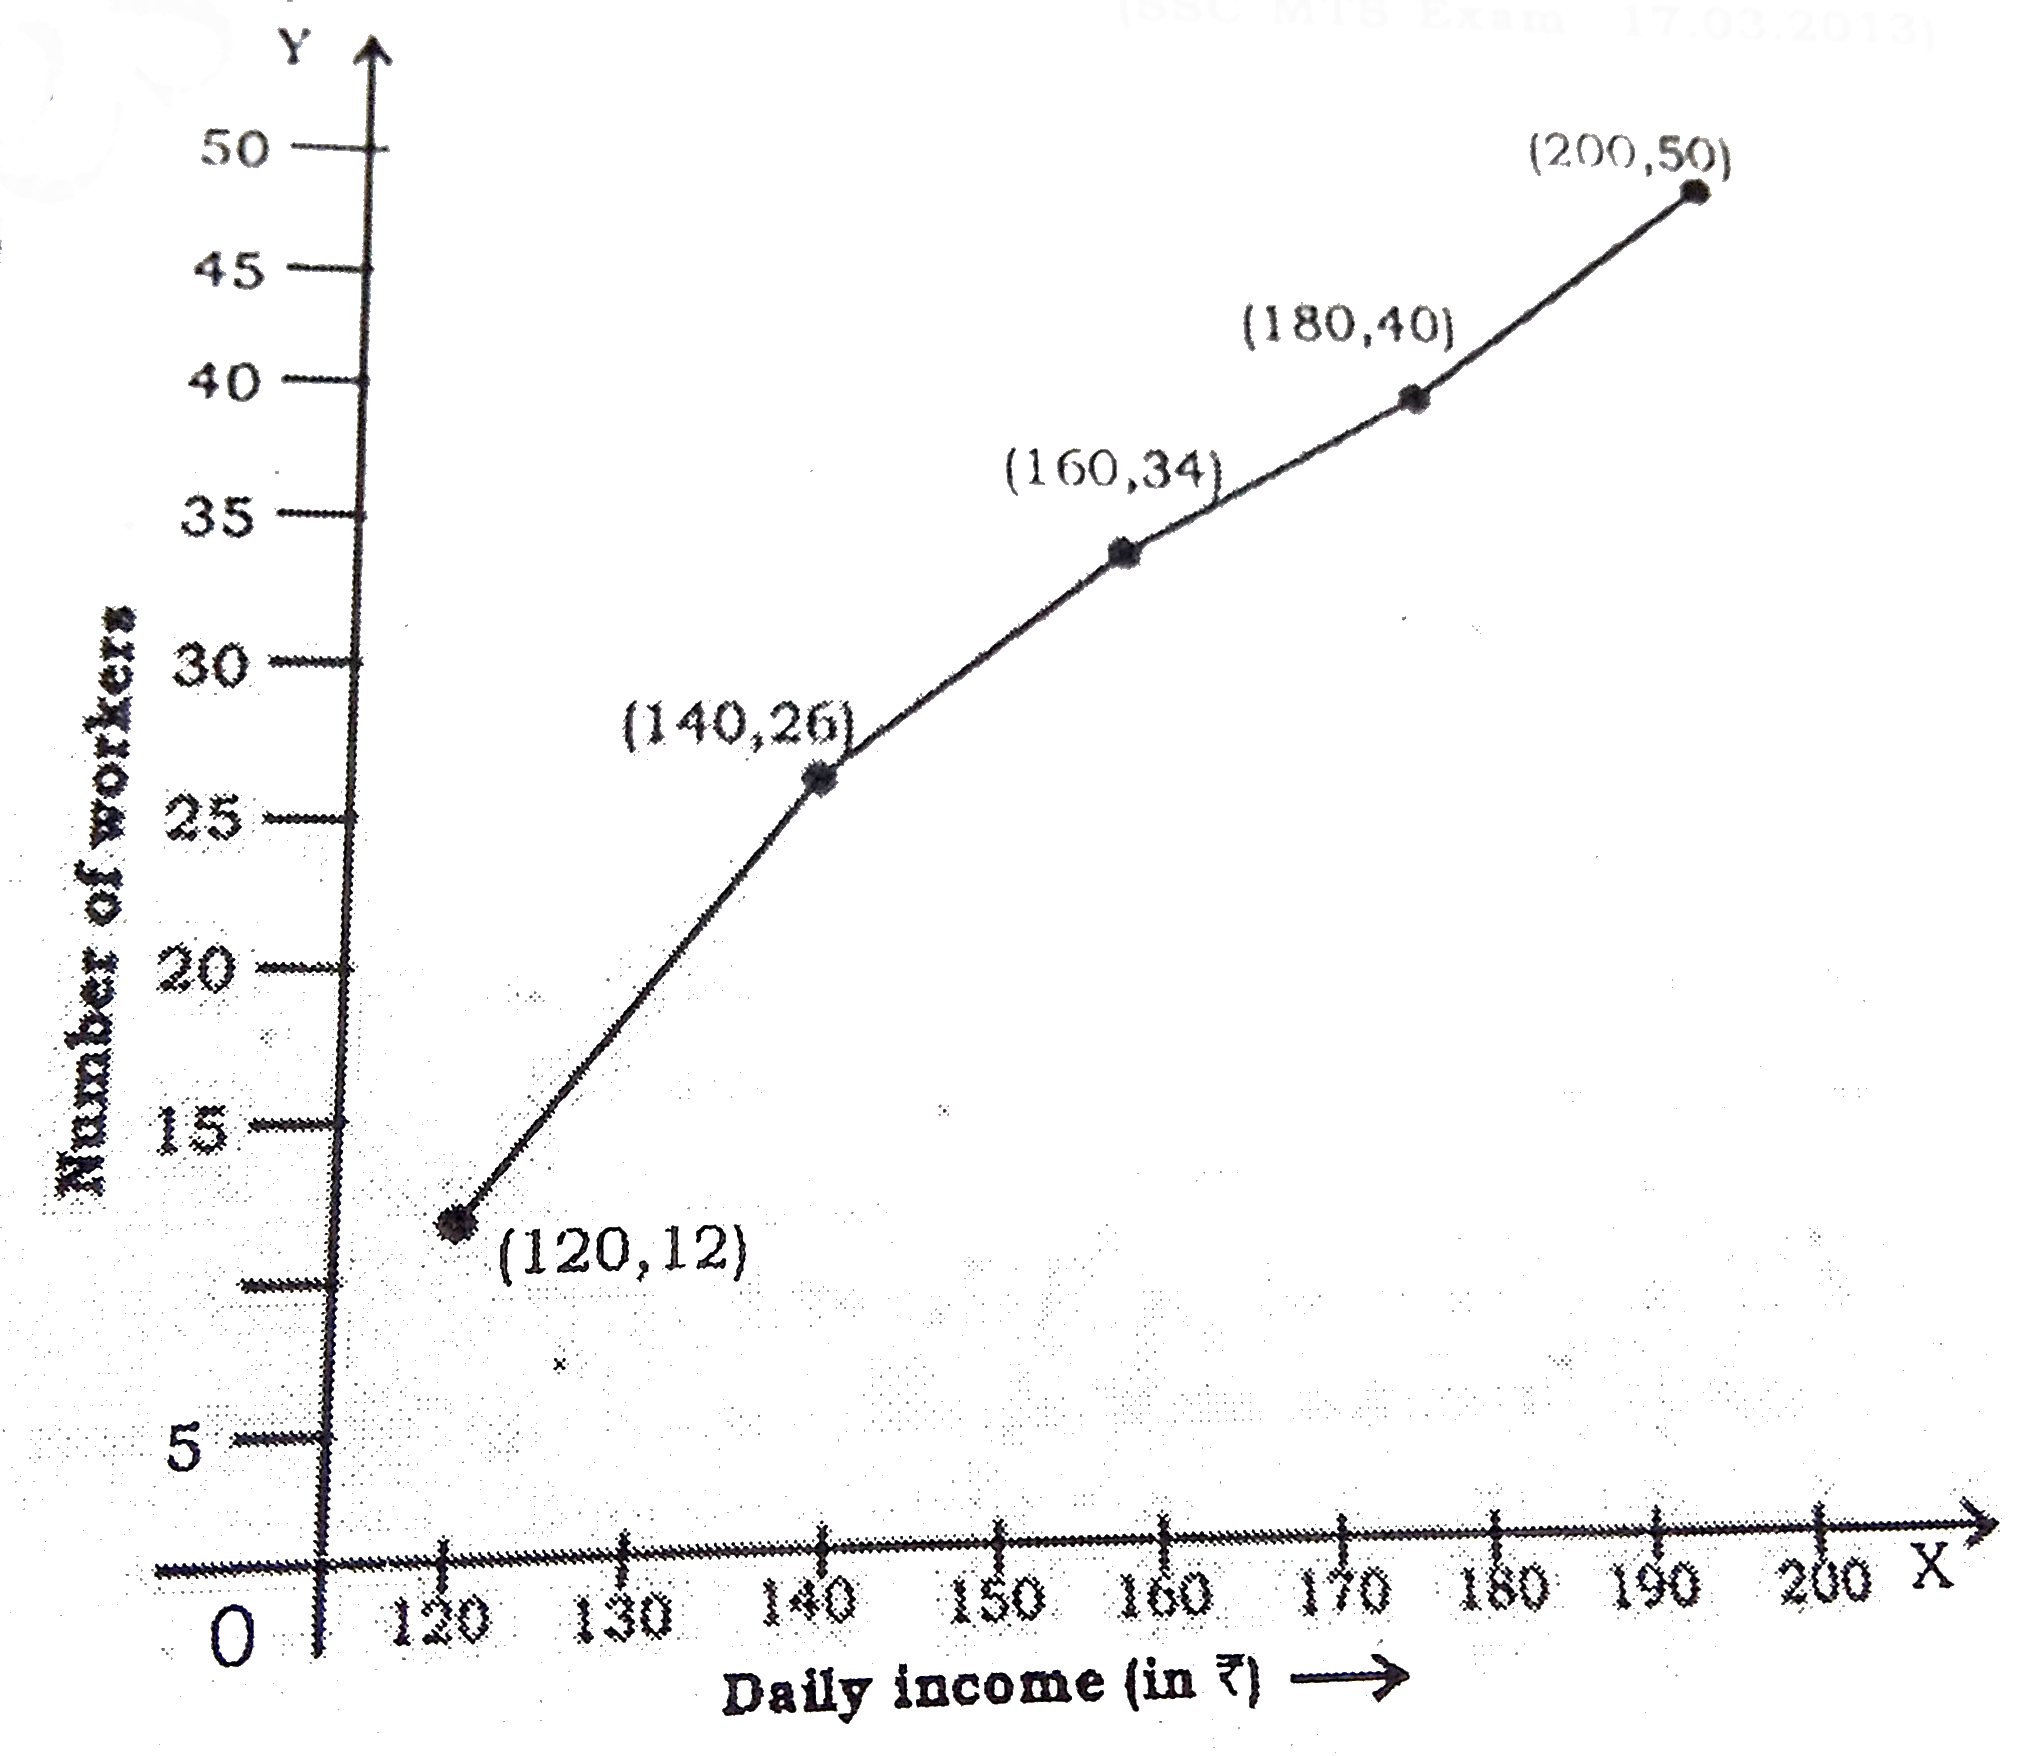
कारखाने में मजदूरी का औसत माध्य कितना है ।A6%B16%C12%D20%
The graph shows Income and Expenditure of a company. Study the graph and answer the questions.
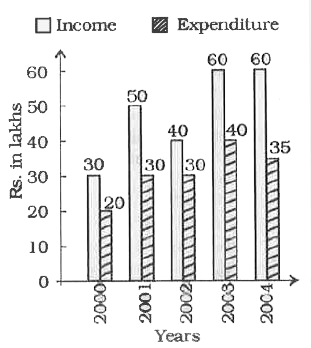
The profit was maximum in the year
View SolutionFind the mean of the daily wages of 60 workers in a factory as per given below
View SolutionThe following table given the daily income of 50 workers of a factory :

Find the mean, mode nad median of above data.
View SolutionThe graph shows Income and Expenditure of a company. Study the graph and answer the questions.
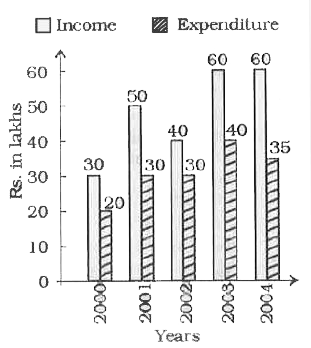
The difference in profit between 2001 and 2002 is
View SolutionFind the mean of daily wages of 40 workers in a factory as per data given below:

View SolutionThe graph shows Income and Expenditure of a company. Study the graph and answer the questions.
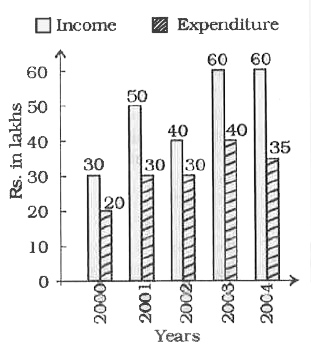
The expenditure from 2002 to 2003 increased by
View SolutionFollowing graph shows the income of a company in six different years. Study the graph , carefully and answer the questions that follow.
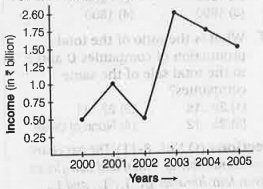
In which year income of the company is the highest?
View Solution
