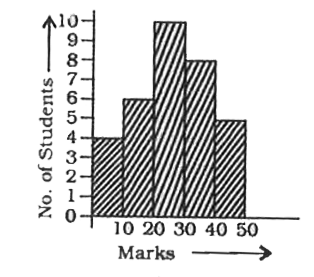
Study the histogram of marks (in Mathematics) distribution of 50 students of class IX and answer the following questions.
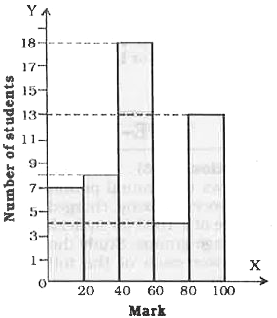
The average marks of the students are
53.2
45.5
60.2
55.5
The correct Answer is:A
Step by step video, text & image solution for Study the histogram of marks (in Mathematics) distribution of 50 students of class IX and answer the following questions. The average marks of the students are by Maths experts to help you in doubts & scoring excellent marks in Class 14 exams.
Updated on:21/07/2023Topper's Solved these Questions
- STATISTICS AND DATA INTERPRETATIONBook:KIRAN PUBLICATIONChapter:STATISTICS AND DATA INTERPRETATIONExercise:TYPE-VI
Explore 86 Videos
- STATISTICS AND DATA INTERPRETATIONBook:KIRAN PUBLICATIONChapter:STATISTICS AND DATA INTERPRETATIONExercise:TYPE-VII
Explore 363 Videos
- STATISTICS AND DATA INTERPRETATIONBook:KIRAN PUBLICATIONChapter:STATISTICS AND DATA INTERPRETATIONExercise:TYPE-IV
Explore 182 Videos
- SIMPLIFICATIONBook:KIRAN PUBLICATIONChapter:SIMPLIFICATIONExercise:TEST YOURSELF
Explore 25 Videos
- TIME AND DISTANCEBook:KIRAN PUBLICATIONChapter:TIME AND DISTANCEExercise:Type -XI
Explore 74 Videos
Similar Questions
Study the histogram of marks (in Mathematics) distribution of 50 students of class IX and answer the following questions.
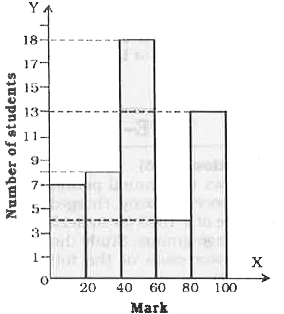
The number of students who have secured marks less than 60 is :
View SolutionStudy the following histogram of marks in mathematics (out of 50) of students in a class and answer the following questions.
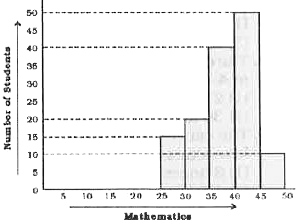
The total number of students in the class is :
View Solution
Knowledge Check
Study the histogram of marks (in Mathematics) distribution of 50 students of class IX and answer the following questions.

The average marks of the students areA53.2B45.5C60.2D55.5Study the histogram of marks (in Mathematics) distribution of 50 students of class IX and answer the following questions.
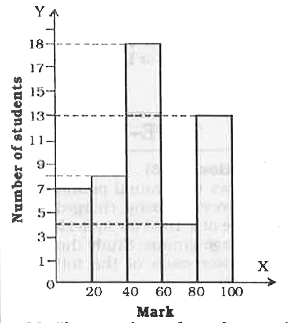
The percentage of students who have secured marks more than 59 is :A13B17C34D26Study the histogram of marks (in Mathematics) distribution of 50 students of class IX and answer the following questions.
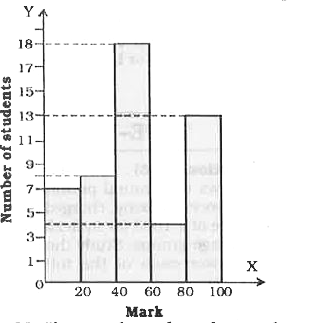
The number of students who have scored between 39 and 80 is :A22B18C37D15
Study the following histogram of marks in mathematics (out of 50) of students in a class and answer the following questions.
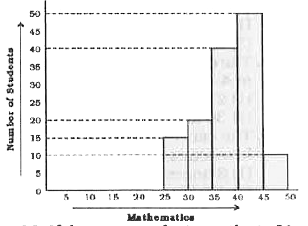
The percentage of number of passed students is (31 is the pass marks)
View SolutionStudy the following histogram of marks in mathematics (out of 50) of students in a class and answer the following questions.
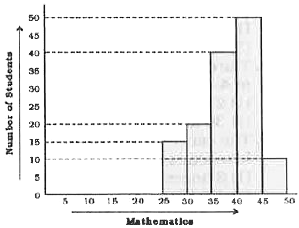
If the pass marks in maths is 31, the number of students who failed in maths is :
View SolutionStudy the following histogram of marks in mathematics (out of 50) of students in a class and answer the following questions.
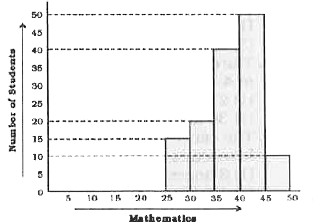
If the students have got the marks out of 50 abnd if A+ grade has been declared for above 90%, then the number of students who have got A+ grade is :
View Solution_2019_CBT6_E01_019_Q01.png)
The marks of 20 students in an examination are given in the following table. Average marks of these student is:
View SolutionStudy the following Histogram and answer the following questions.
The least number of students got the marks in the interval
View Solution
