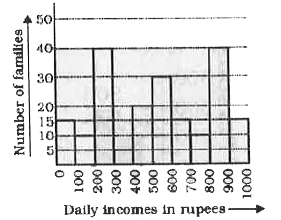
The histogram, given below, shows the number of families of a locality having various daily incomes, as obtained by a survey. Observe the graph and answer the questions based on it.
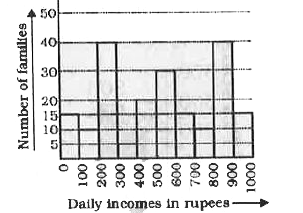
What percent of families have their daily incomes less than Rs 500 ?
90%
45%
30%
20%
The correct Answer is:B
Step by step video, text & image solution for The histogram, given below, shows the number of families of a locality having various daily incomes, as obtained by a survey. Observe the graph and answer the questions based on it. What percent of families have their daily incomes less than Rs 500 ? by Maths experts to help you in doubts & scoring excellent marks in Class 14 exams.
Updated on:21/07/2023Topper's Solved these Questions
- STATISTICS AND DATA INTERPRETATIONBook:KIRAN PUBLICATIONChapter:STATISTICS AND DATA INTERPRETATIONExercise:TYPE-VI
Explore 86 Videos
- STATISTICS AND DATA INTERPRETATIONBook:KIRAN PUBLICATIONChapter:STATISTICS AND DATA INTERPRETATIONExercise:TYPE-VII
Explore 363 Videos
- STATISTICS AND DATA INTERPRETATIONBook:KIRAN PUBLICATIONChapter:STATISTICS AND DATA INTERPRETATIONExercise:TYPE-IV
Explore 182 Videos
- SIMPLIFICATIONBook:KIRAN PUBLICATIONChapter:SIMPLIFICATIONExercise:TEST YOURSELF
Explore 25 Videos
- TIME AND DISTANCEBook:KIRAN PUBLICATIONChapter:TIME AND DISTANCEExercise:Type -XI
Explore 74 Videos
Similar Questions
The histogram, given below, shows the number of families of a locality having various daily incomes, as obtained by a survey. Observe the graph and answer the questions based on it.
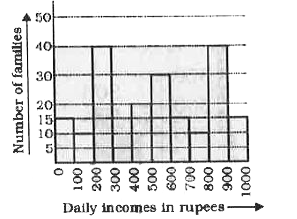
The number of families, whose daily incomes are Rs 800 or above, is
View SolutionThe bar graph given below shows the spending of a family income on various items and savings during 1993. Observe the graph and answer the following questions :
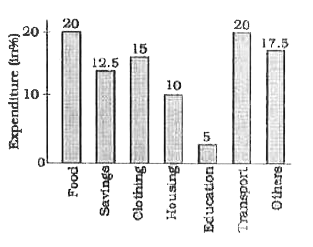
The percent of income spent on food is :
View Solution
Knowledge Check
The histogram, given below, shows the number of families of a locality having various daily incomes, as obtained by a survey. Observe the graph and answer the questions based on it.
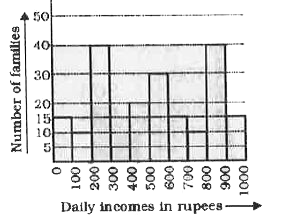
The number of families, whose daily incomes are between Rs 500 and Rs 800, isA35B40C45D55The histogram, given below, shows the number of families of a locality having various daily incomes, as obtained by a survey. Observe the graph and answer the question based on it.
In all, how many families were surveyed ?A235B220C200D195The histogram, given below, shows the number of families of a locality having various daily incomes, as obtained by a survey. Observe the graph and answer the questions based on it.
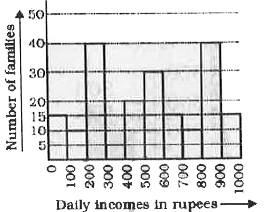
The number of families, whose daily incomes are below Rs 200, isA25B20C15D10
The pie chart given below shows the spendings of a family on various heads during a month. Study the graph and answer the questions
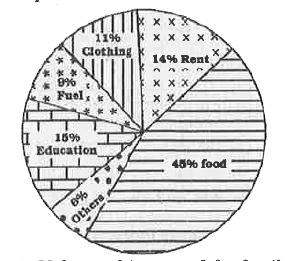
Expenditure on Rent is what percent of expenditure on Fuel?
View SolutionObserve the histogram and answer the questions given below.
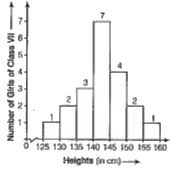
How many girls have a height of 145 cm and more?
View SolutionThe bar graph given below shows the spending of a family income on various items and savings during 1993. Observe the graph and answer the following questions :
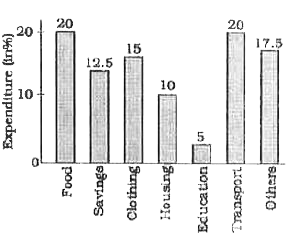
The percent of income spent on clothing exceeds that on savings by :
View SolutionThe bar graph given below shows the spending of a family income on various items and savings during 1993. Observe the graph and answer the following questions :
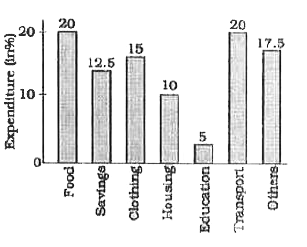
The savings of the family is more than that of expenditure incurred on:
View SolutionThe pie chart given below shows the spending of a family on various heads during a month. Study the graph and answer the following questions.
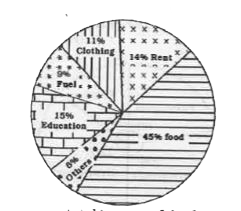
Expenditure on Rent is what percent of expenditure on Fuel?
View Solution
