Study the bar chart given below and answer the following questions :
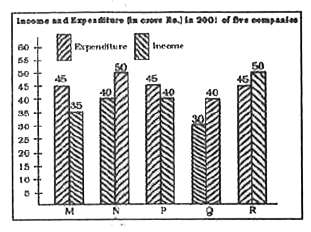
If the income of comapy Q in 2001 was 10% more than that in 2000 and the company had earned a profit of 20% in 2000, then its expenditure in 2000 (in crores Rs.) was :
34.34
28.28
29.09
32.32
Step by step video, text & image solution for Study the bar chart given below and answer the following questions : If the income of comapy Q in 2001 was 10% more than that in 2000 and the company had earned a profit of 20% in 2000, then its expenditure in 2000 (in crores Rs.) was : by Maths experts to help you in doubts & scoring excellent marks in Class 14 exams.
Updated on:21/07/2023Topper's Solved these Questions
- STATISTICS AND DATA INTERPRETATIONBOOK - KIRAN PUBLICATIONCHAPTER - STATISTICS AND DATA INTERPRETATIONEXERCISE - TYPE-V
38 Videos
- STATISTICS AND DATA INTERPRETATIONBOOK - KIRAN PUBLICATIONCHAPTER - STATISTICS AND DATA INTERPRETATIONEXERCISE - TYPE-VI
86 Videos
- STATISTICS AND DATA INTERPRETATIONBOOK - KIRAN PUBLICATIONCHAPTER - STATISTICS AND DATA INTERPRETATIONEXERCISE - TYPE-III
39 Videos
- SIMPLIFICATIONBOOK - KIRAN PUBLICATIONCHAPTER - SIMPLIFICATIONEXERCISE - TEST YOURSELF
25 Videos
- TIME AND DISTANCEBOOK - KIRAN PUBLICATIONCHAPTER - TIME AND DISTANCEEXERCISE - Type -XI
74 Videos
Similar Questions
Study the graph and answer the question
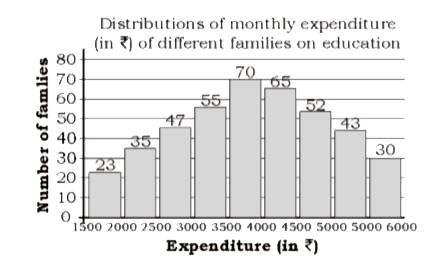
The number of families whose montly expenditures on education are Rs 2000 or more but less than Rs 4000 is
View SolutionThe pie-chart represents the profits earned by a certain company in seven consecutive years. Study the pie-chart carefully and answer the question.
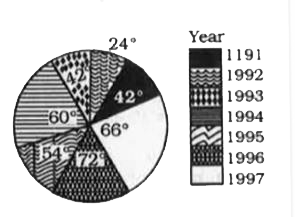
If the expenditure in the year 1993 was 30% more than the expenditure in the year 1991, then the income in the year 1993 exceeds the income in the year 1991 by 30% of
View Solution
Knowledge Check
Study the bar chart given below and answer the following questions :
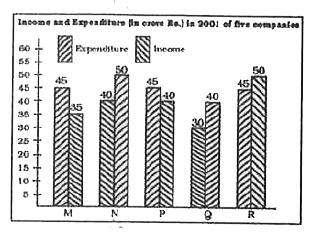
The company earning the maximum percentage of profit in the year 2001 is :AQBMCNDPStudy the bar chart given below and answer the following questions :
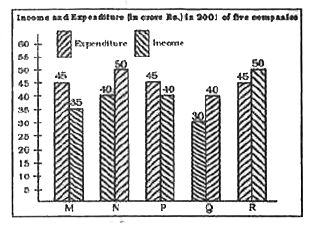
The companies M and N together had a percentage of profit/loss of :ANo loss and no profitB12% lossC10% lossD10% profitStudy the bar chart given below and answer the following questions :
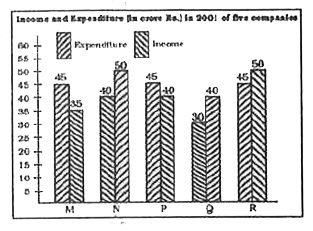
In 2001, the approximate percentage of profit/loss of all the five companies taken together is equal toA6.88% lossB4.65% profitC6.48% profitD4% loss
Study the bar diagram and answer the questions.
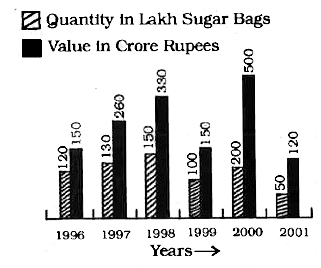
Percentage fall in value from 2000 to 2001 is
View SolutionThe bar graph shows the monthly profits of the different departments of a company. Study the diagram and answer the following questions.
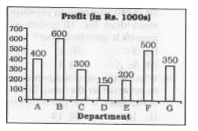
If the company has only departments then what is the monthly revenue (in Rs. Lakhs) of the company if the monthly profit was 20% of the total monthly revenue of the company?
View Solutionthe given bar graph presents income and Expenditure of a company for the five years, 2014 to 2018
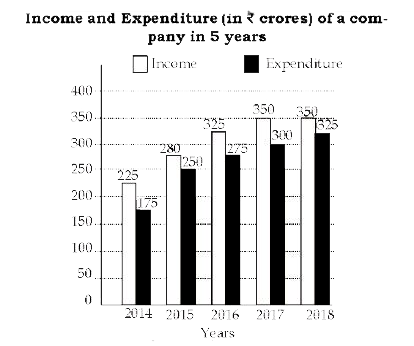
The average income of the company in five years in what percentage more than its expenditure in 2015?
View SolutionStudy the following graph to answer the given questions.
Per cent profit earned by two companies over the given years

For Company X its income in 2001-02 was equal to its expenditure in 2002-03. What questions was the ratio of its respective incomes in these two years?
View SolutionThe following bar diagram analys the sale of a company from 2000 to 2005, Examine the diagram and answer the questions.
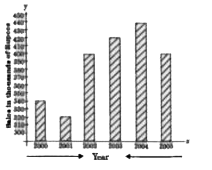
By what amount are the sales in 2003 more than those in 2001 ?
View Solution
