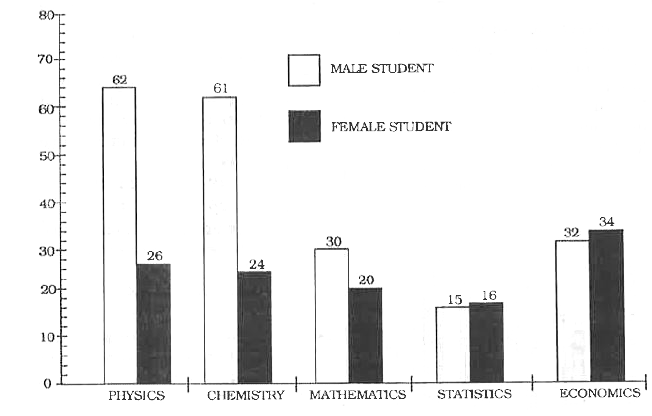
The data given in Bar diagram relate to the department wise admission of 320 students to B.Sc. (Honours) first year classes of a certain college in the given five subjetcs. Study the graph and answer the questions.
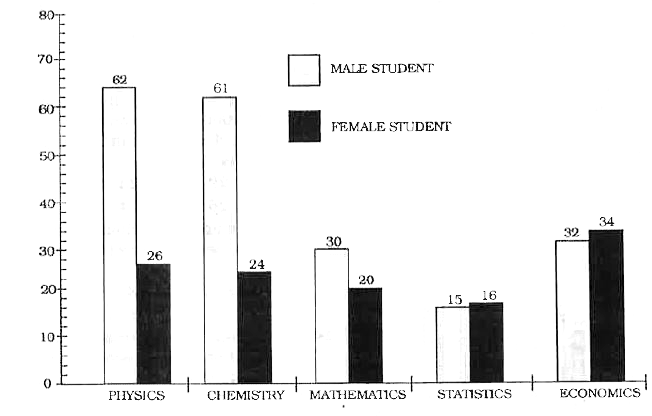
The diffrence of the choice of the subject between male and female students is maximum for the subject.
Physics
Sattistics
Economics
Chemistry
The correct Answer is:D
Step by step video, text & image solution for The data given in Bar diagram relate to the department wise admission of 320 students to B.Sc. (Honours) first year classes of a certain college in the given five subjetcs. Study the graph and answer the questions. The diffrence of the choice of the subject between male and female students is maximum for the subject. by Maths experts to help you in doubts & scoring excellent marks in Class 14 exams.
Updated on:21/07/2023Topper's Solved these Questions
- STATISTICS AND DATA INTERPRETATIONBOOK - KIRAN PUBLICATIONCHAPTER - STATISTICS AND DATA INTERPRETATIONEXERCISE - TYPE-V
38 Videos
- STATISTICS AND DATA INTERPRETATIONBOOK - KIRAN PUBLICATIONCHAPTER - STATISTICS AND DATA INTERPRETATIONEXERCISE - TYPE-VI
86 Videos
- STATISTICS AND DATA INTERPRETATIONBOOK - KIRAN PUBLICATIONCHAPTER - STATISTICS AND DATA INTERPRETATIONEXERCISE - TYPE-III
39 Videos
- SIMPLIFICATIONBOOK - KIRAN PUBLICATIONCHAPTER - SIMPLIFICATIONEXERCISE - TEST YOURSELF
25 Videos
- TIME AND DISTANCEBOOK - KIRAN PUBLICATIONCHAPTER - TIME AND DISTANCEEXERCISE - Type -XI
74 Videos
Similar Questions
Read the following information carefully and answer the questions given below.
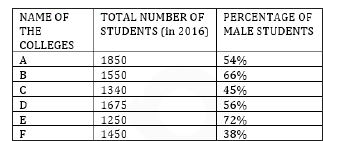
Find the average difference between the number of male and female students in all the colleges?
View SolutionThe line graph shows the number of students of a certain university who failed in the given year in their final exams. Study the diagram and answer the following questions
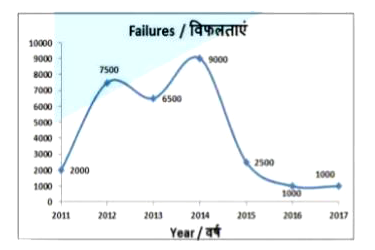
What was the difference in failures between the years 2011 and 2013?
View Solution
Knowledge Check
The data given in Bar diagram relate to the department wise admission of 320 students to B.Sc. (Honours) first year classes of a certain college in the given five subjetcs. Study the graph and answer the questions.
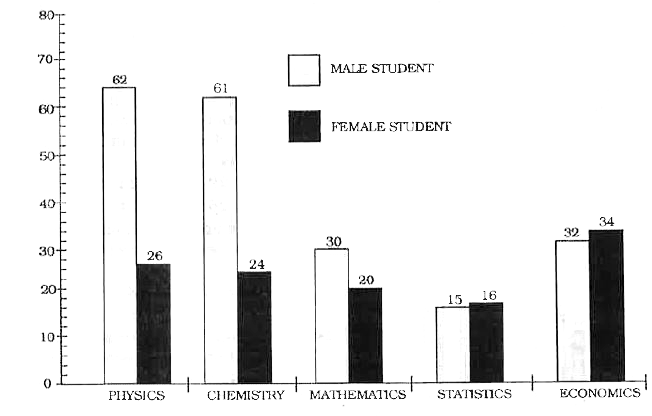
The subject in which the difference in the number of male and female students is minimum in :AEconomicsBPhysicsCStatisticsDChemis tryThe data given in Bar diagram relate to the department wise admission of 320 students to B.Sc. (Honours) first year classes of a certain college in the given five subjetcs. Study the graph and answer the questions.
The subject which the female students are finding difficult as compared to other subjects is :AStatisticsBEconomcsCMathematicsDChemistryThe data given in Bar diagram relate to the department wise admission of 320 students to B.Sc. (Honours) first year classes of a certain college in the given five subjetcs. Study the graph and answer the questions.
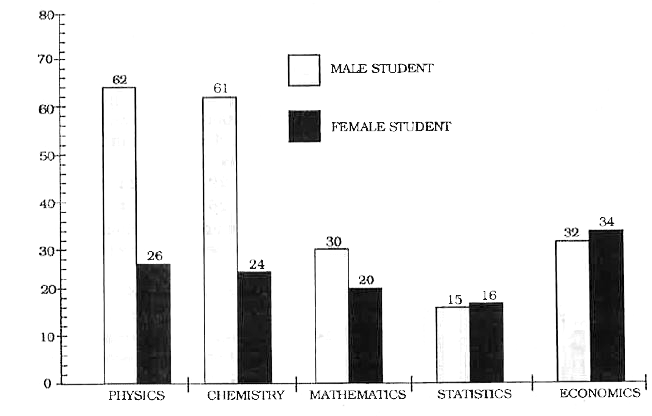
The total number of male students who got admitted in Mathematics and Economics as compared to the total number of female students getting admission in Mathematics and Economics is :Aless by 17%Bmore by 4.2%Cmore by 18.4%Dmore by 12.8%
The line graph show the number of students admitted in the given year to a certain university. Study the diagram and answer the following questions.
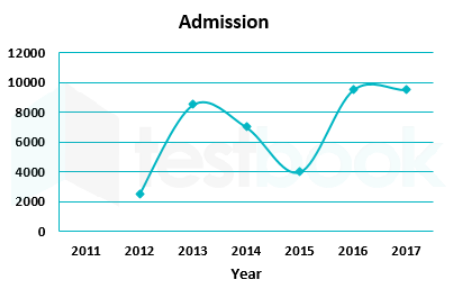
What was the difference in admissions between the years 2016 and 2012 ?
View SolutionThe line graph shows the number of students of a certain university who passed in the given year in their final exams. Study the diagram and answer the following questions.
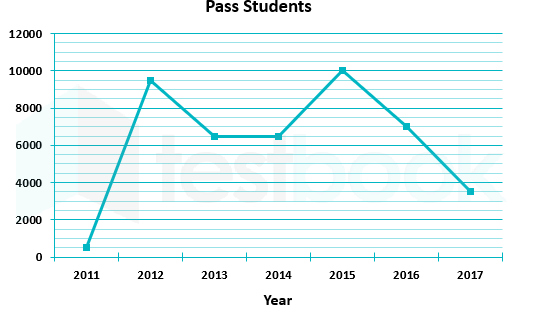
What was the difference in the number of students who passed between the years 2013 and 2016?
View SolutionThe bar graph shows the number of students (in hundreds) admitted and passed out per year in a college during the years 2010 to 2014.
Study the bar graph and answer the question.
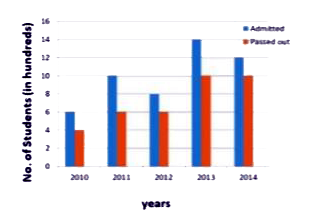
In which of the following years, was the pass percentage between 80 and 85?
View SolutionThe subjectwise number of applicants for the year 2008 and 2009 in a college is given in the following chart. Study the graph and answer the questions.
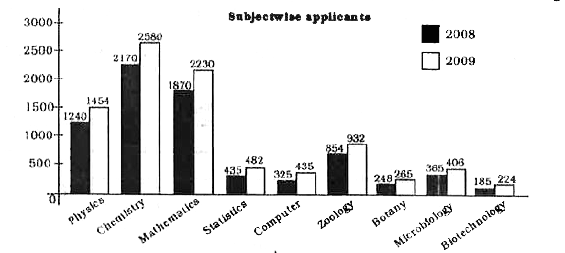
The subject for which growing of demand is maximum is
View SolutionThe subjectwise number of applicants for the year 2008 and 2009 in a college is given in the following chart. Study the graph and answer the questions.
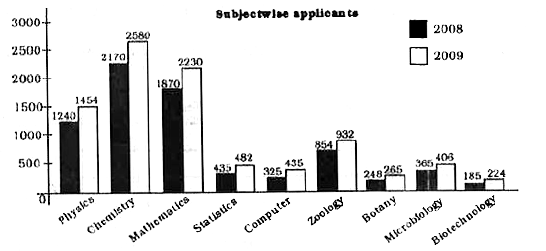
The subject for which growing of demand is minimum is
View Solution
