Draw graphs to show the dependence of force on mass for a constant acceleration
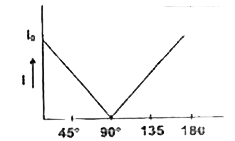
The intensity of transmitted light through an analyser whose polarising axis oriented at an angle with the polarising axes of polariser is given by I=I0cos2θ
This reaction implies that on increasing the value of θfirst I decreases and it becomes zero at θ90∘. On further Increasing the value of 0, starts increasing and again acquire maximum value at e 180∘ This variation of l with is shown in the figure.

Similar Questions
Draw graphs to show the dependence of acceleration on force for a constant mass.
View SolutionDraw graphs to show the dependence of acceleration on force for a constant mass.
View SolutionDraw a graph to show the deviation of real gas from Boyle's law.
View SolutionAsseration : Power of a constant force is also constant.
Reason : Net constant force will always produce a constant acceleration.
View SolutionUnder the action of a constant force, A particle is experiencing a constant acceleration. The power is
View SolutionIn a uniform electric field, a point charge of mass m and charge q is released from rest. If there are no other forces acting on the particle, then which of the following graphs, correctly show the dependence of the particles speed v on the distance x travelled by the particles speed v on the distance x travelled by it? [Graphs are schmatic and not drawn to scale]
View SolutionA flatcar of mass m0 starts moving to the right due to a constant horizontal force F(figure). Sand spills on the flatcar from a stationary hopper. The velocity of loading is constant and equal to μkg/s. Find the time dependence of the velocity and the acceleration of the flatcar in the process of loading. The friction is negligibly small.

View SolutionWhich graph corresponds to an object moving with a constant negative acceleration and a positive velocity ?
View SolutionWhich graph corresponds to an object moving with a constant negative acceleration and a positive velocity ?
View SolutionDraw the graph of y=|x|
View Solution
