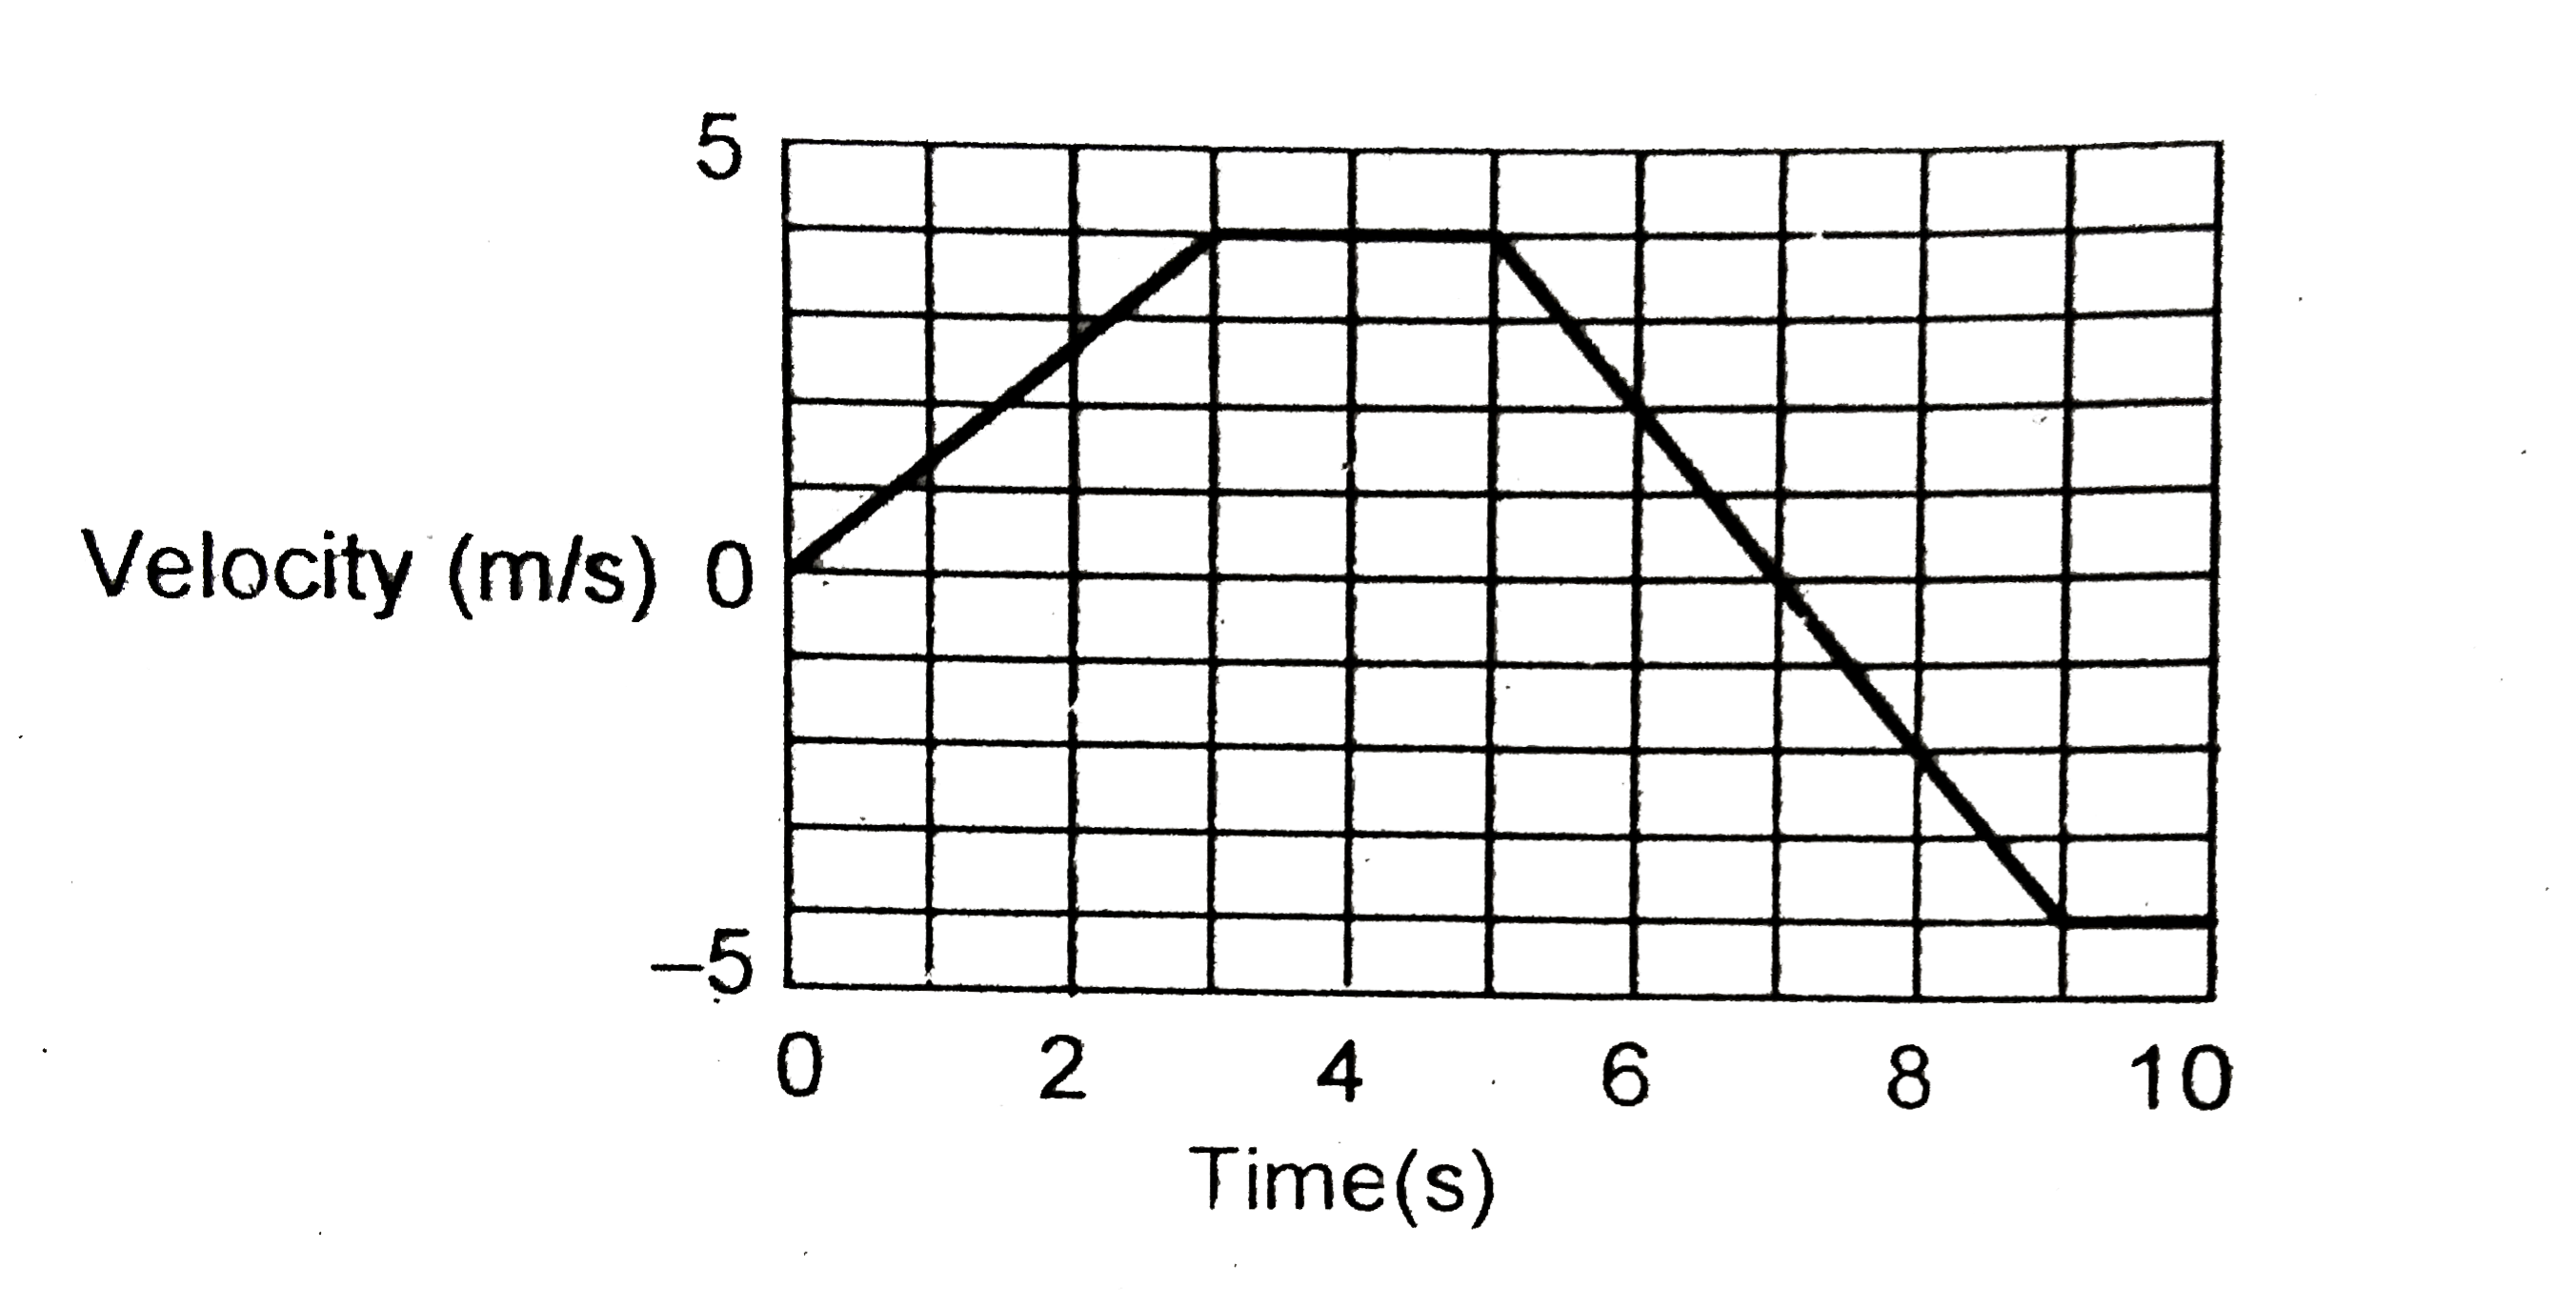
An object starts at the origin in a straight line. Its velocity versus time graph is shown in the figure. Which one of the following choices best gives the proper intervals (s) of time for which the object is moving away from the origin?
Only for times 0s<t<3s
Only for times 0s<t<5s
only for times 3s<t<5s
Only for times 0s<t<7s
The correct Answer is:D
Object is moving away from the origin till velocity is positive.
Similar Questions
A particle starts to move along a straight line. The acceleration versus time graph of particle is as shown in figure. The correct velocity versus time graph is :
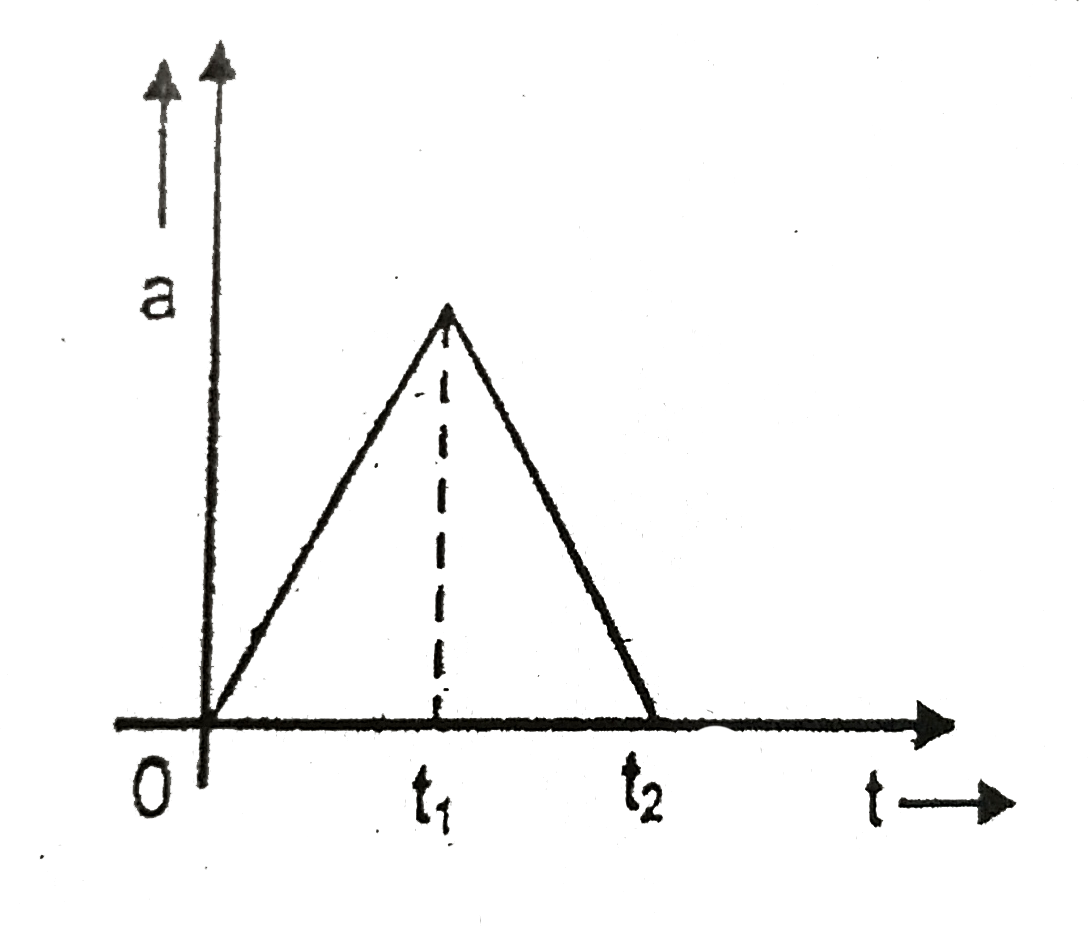
View SolutionA particle starts moving from rest on a straight line. Its acceleration a verses time t is shown in the figure. The speed of the particle is maximum at the instant
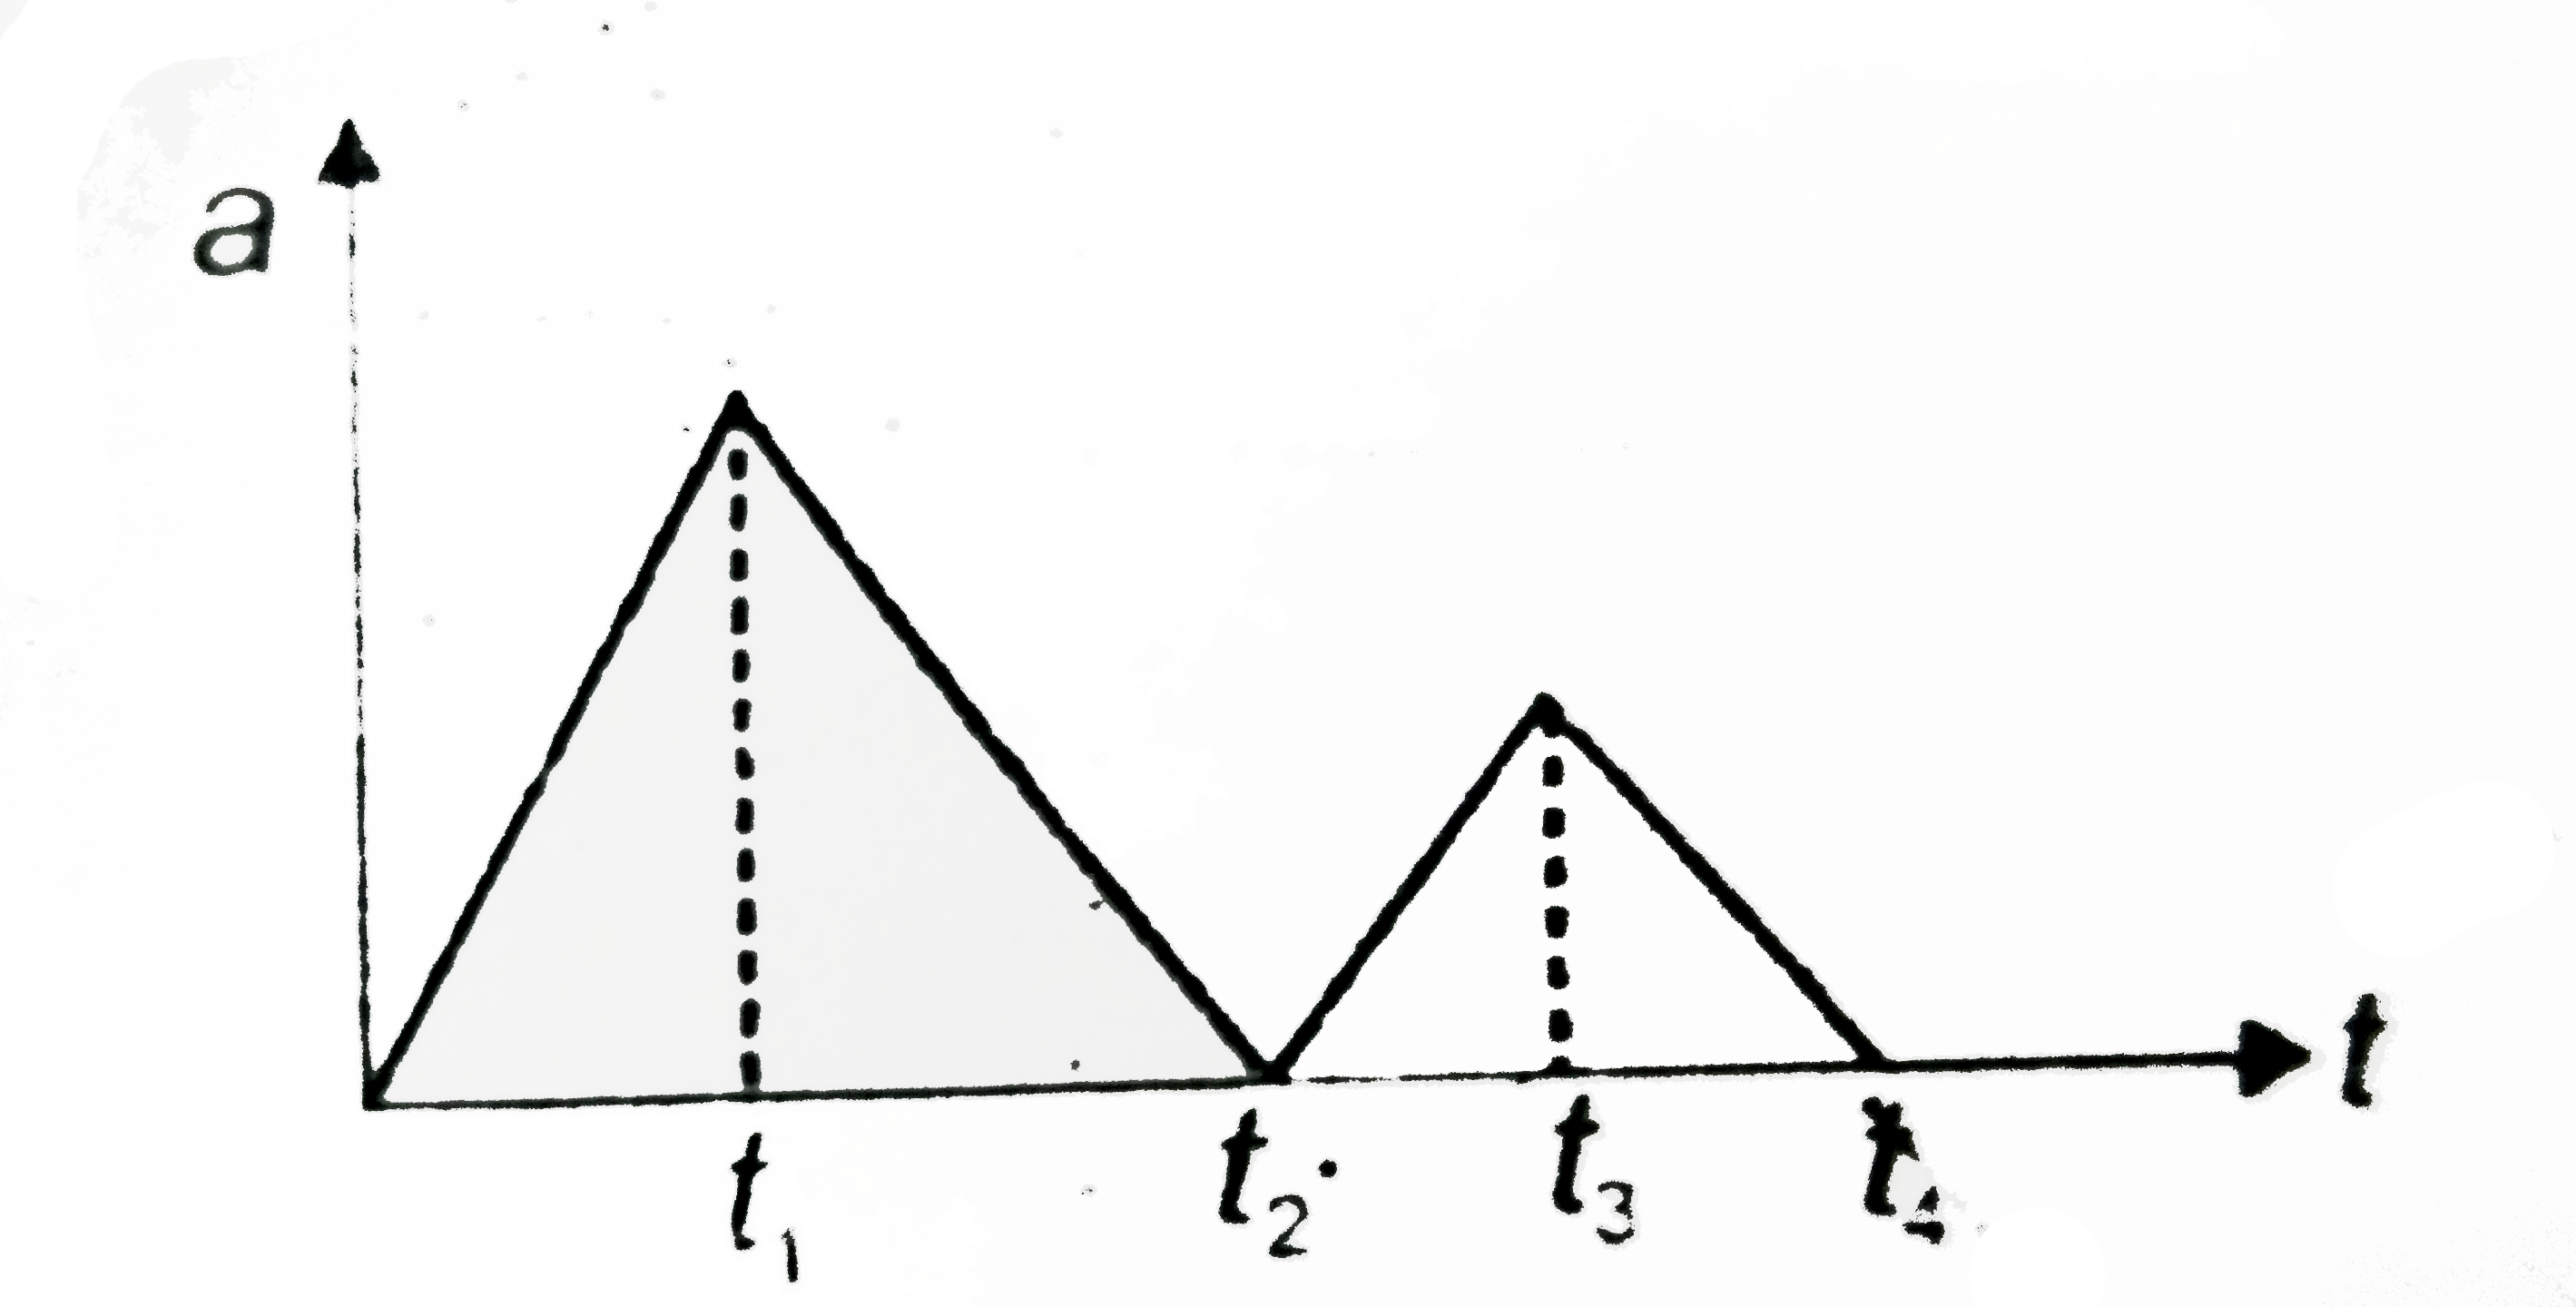
View SolutionA particle moving along straight line has velocity v=μs where s is in the displacement . If s=s0 then which of the following graph best represent s versus t
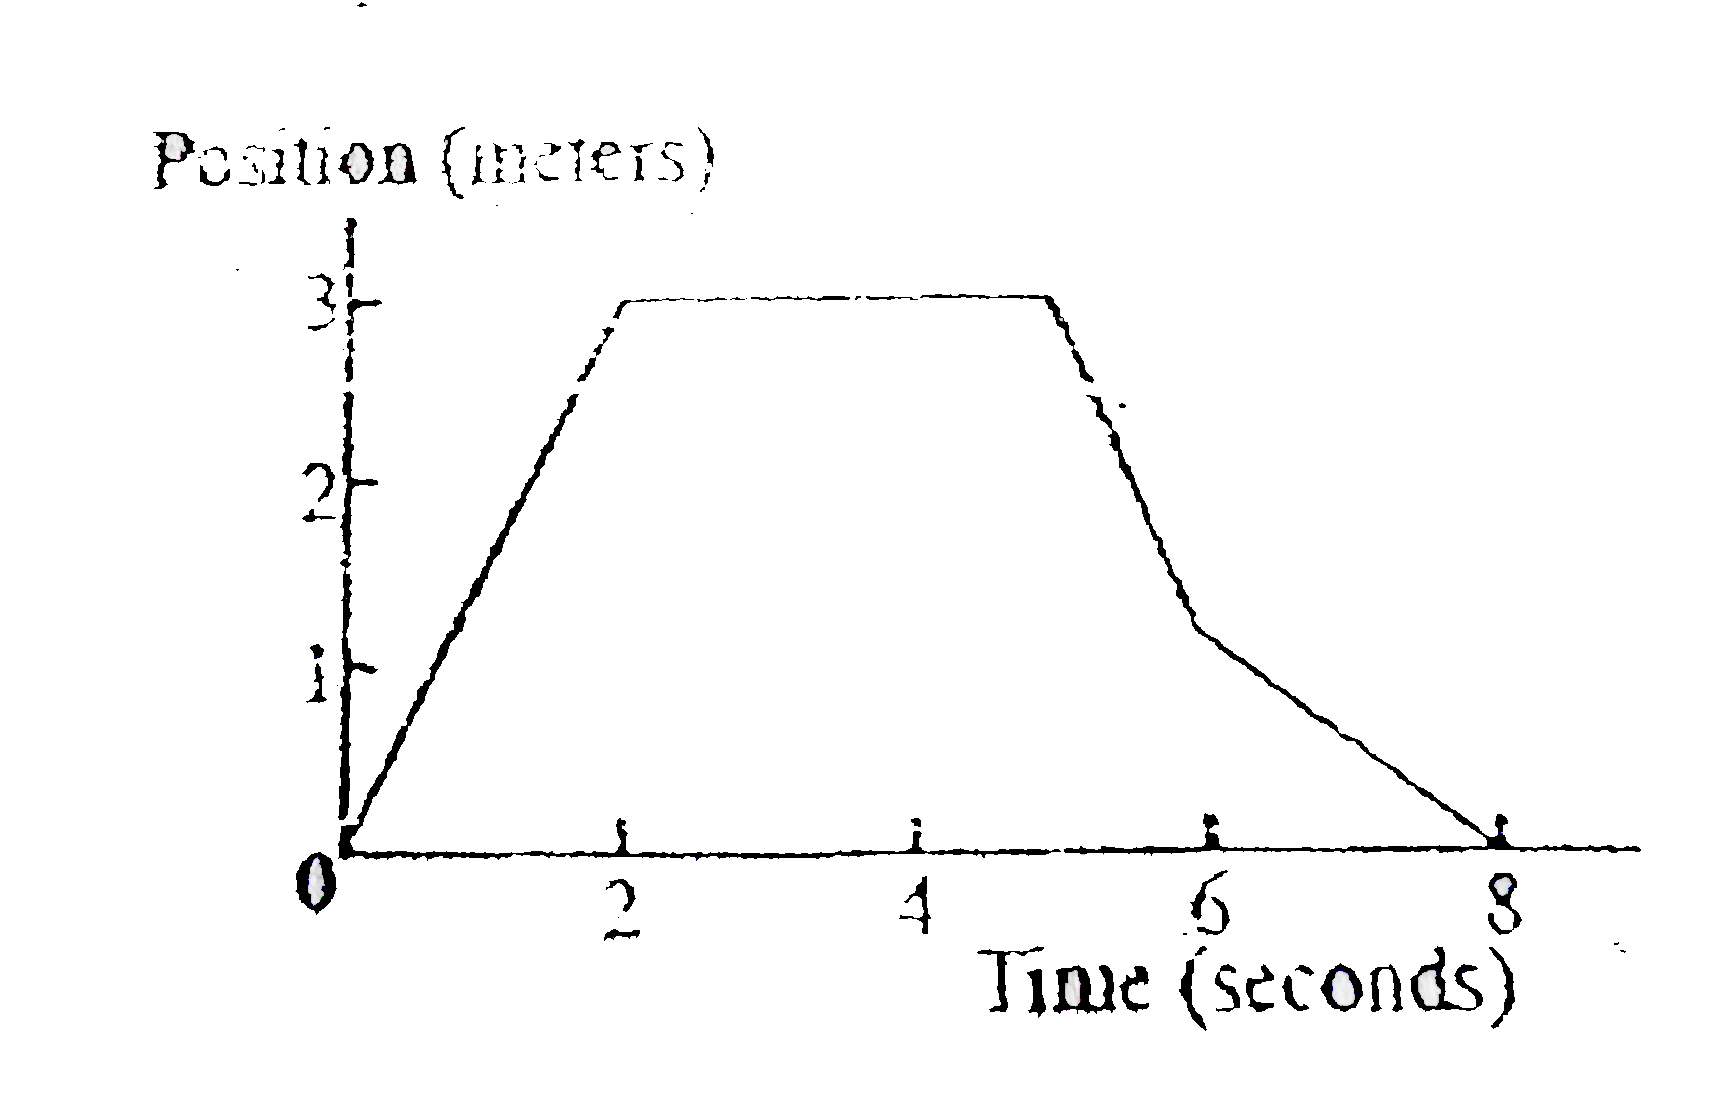
View SolutionAn object is moving in a straight line. Its position versus time graph is shown below. There is a detector at origin which analyze the motion of object between t=6 and t=8 seconds, which statement describes the motion shown in the graph.
View SolutionThe velocity versus time graph of a body moving in a straight line is as shown in the figure below
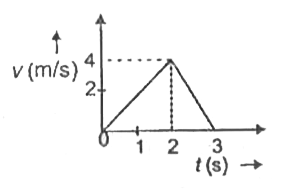
View SolutionFigure shows velocity time graph of a particle moving in straight line. Which of the following statement(s) is / are CORRECT:−
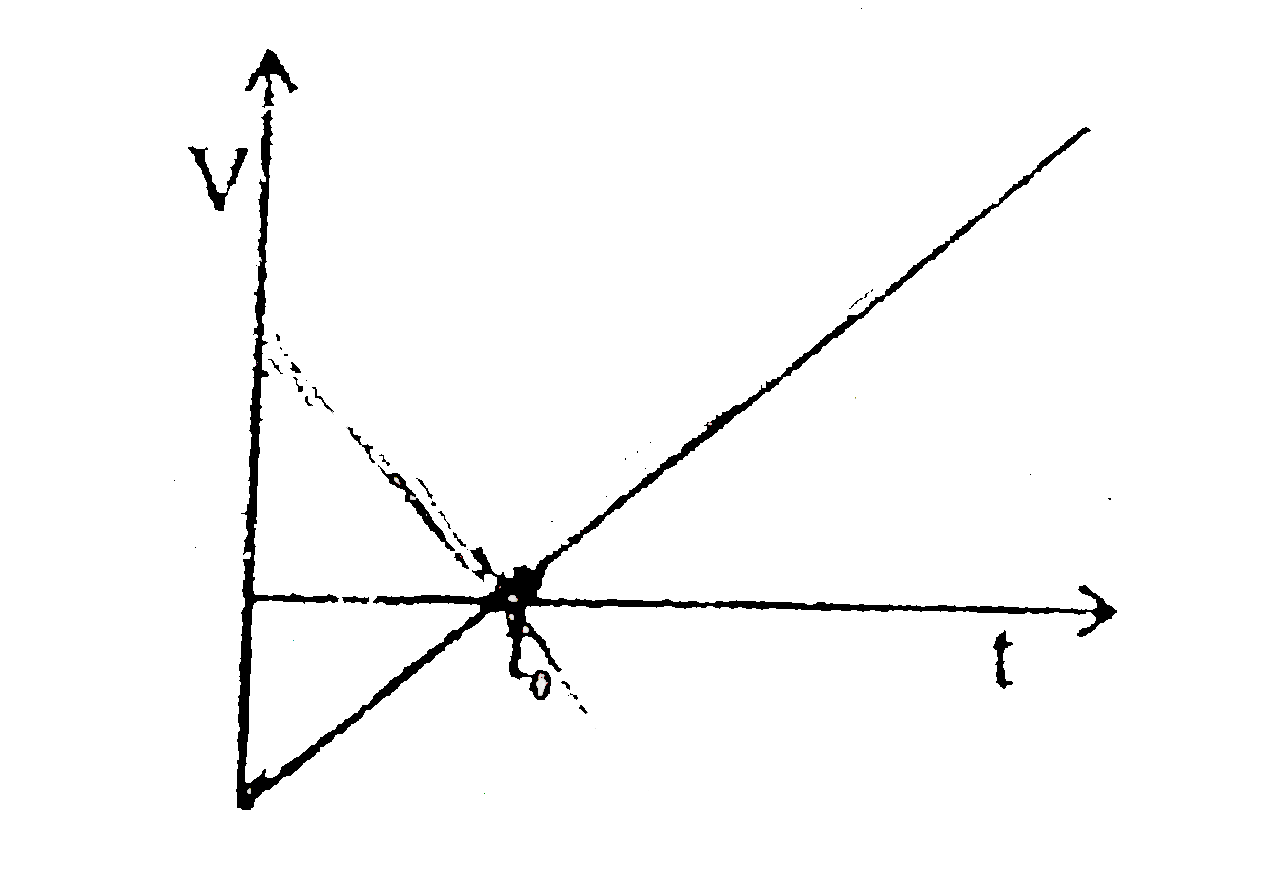
View SolutionA particle starts motion from rest and moves along a straight line. Its velocity-time graph is shown. Find out speed of particle at t=2s and at t=3s.
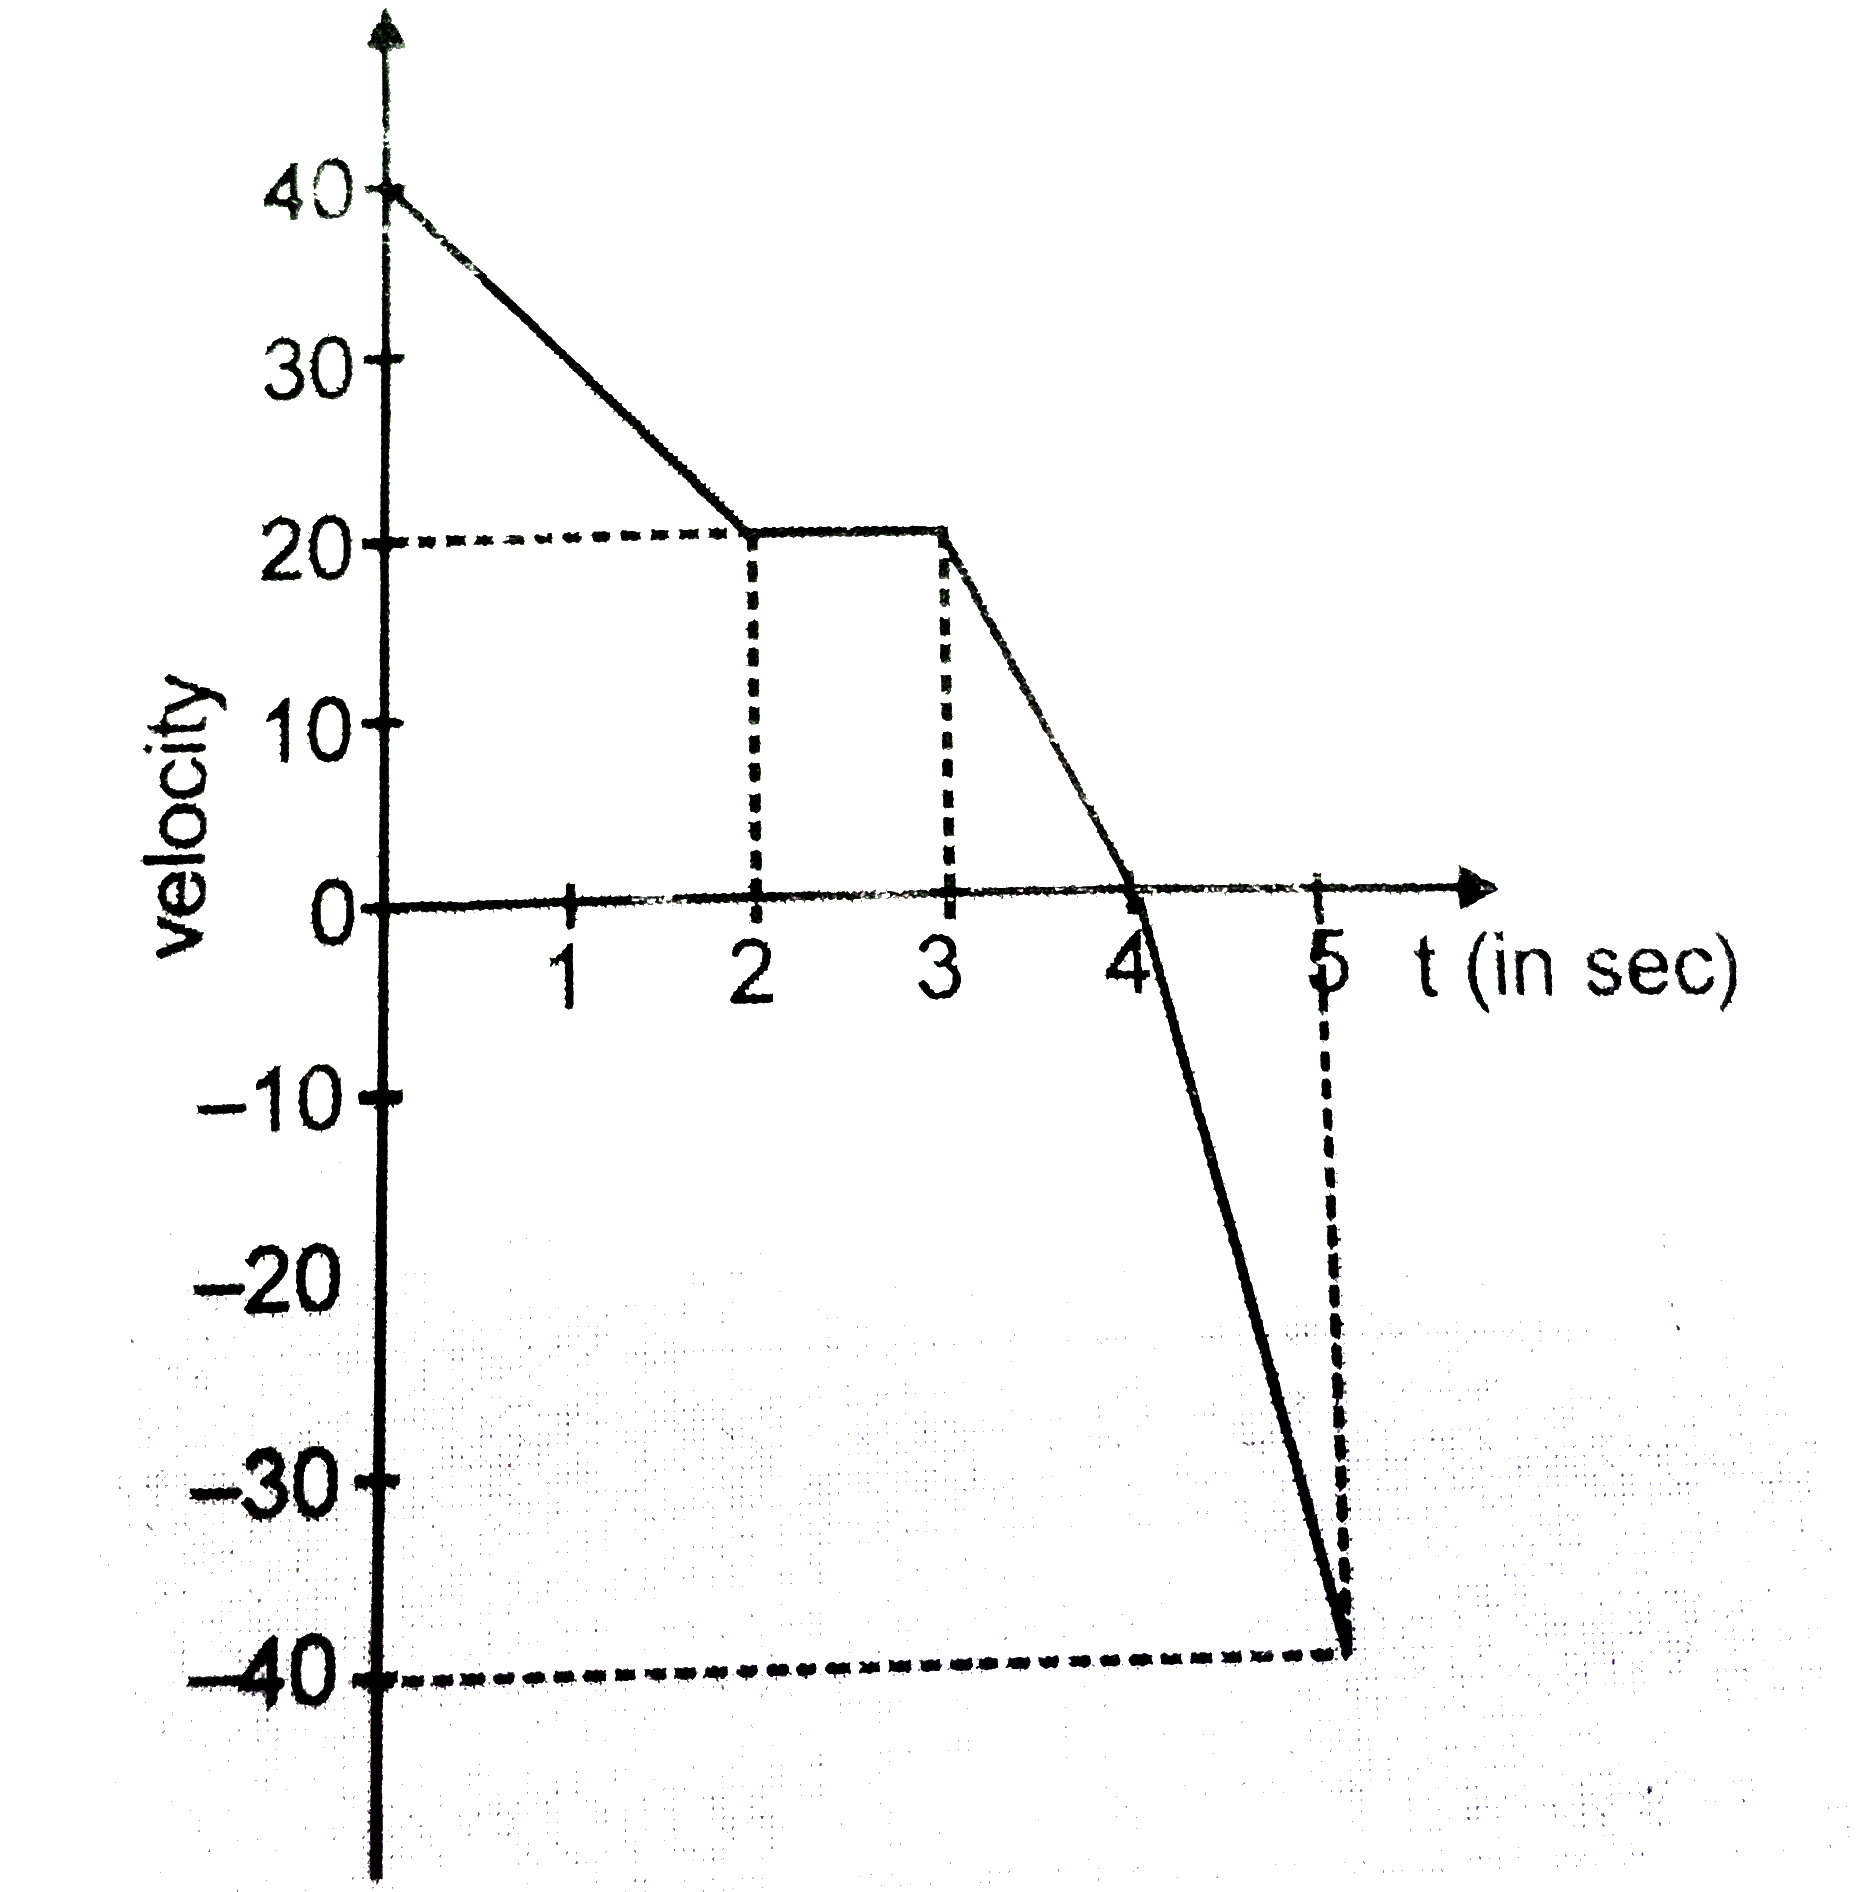
View SolutionThe graph below shws the velocity versus time graph for a body
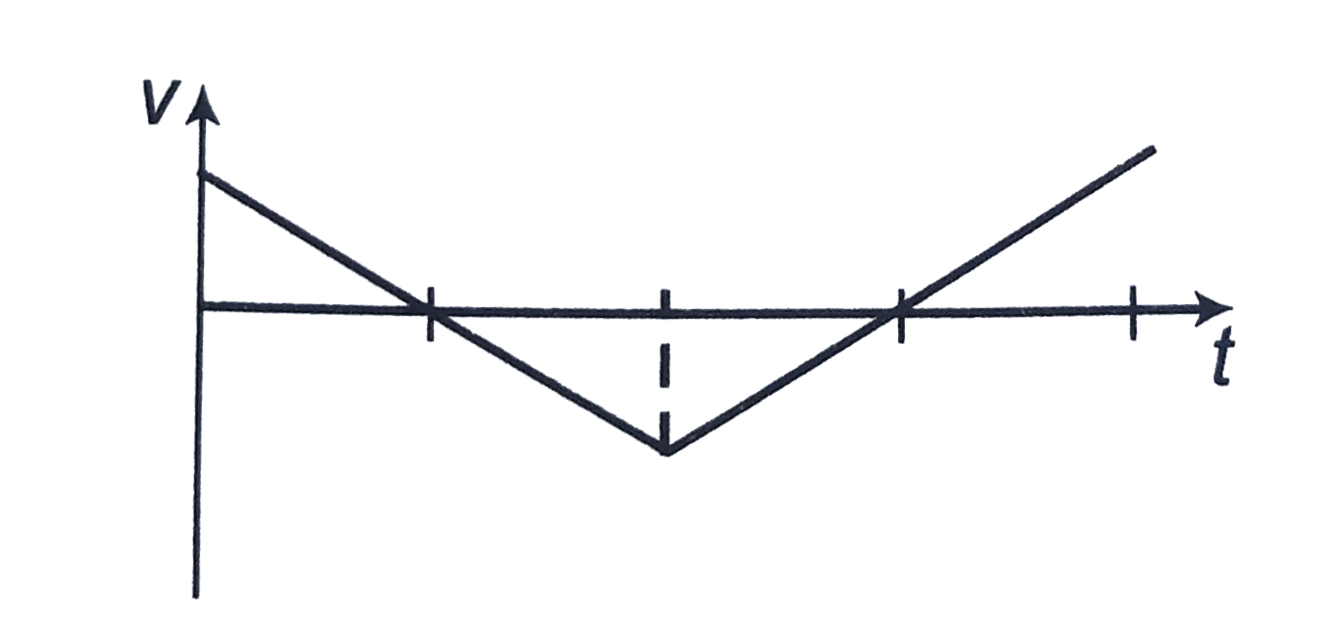
Which of the following graph represents the corresponding acceleration v//s time graph?
View SolutionThe force acting on a particle moving along a straight line varies with time as shown in diagram.
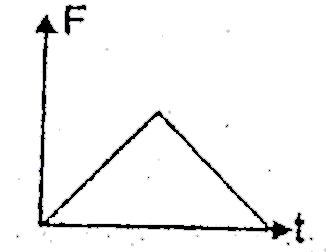
Which of the following graphs is best representative of its speed and time graphs. Initial velocity the particle is zero.
View SolutionThe force acting on a particle moving along a straight line varies with time as shown in diagram.

Which of the following graphs is best representative of its speed and time graphs. Initial velocity the particle is zero.
View Solution
