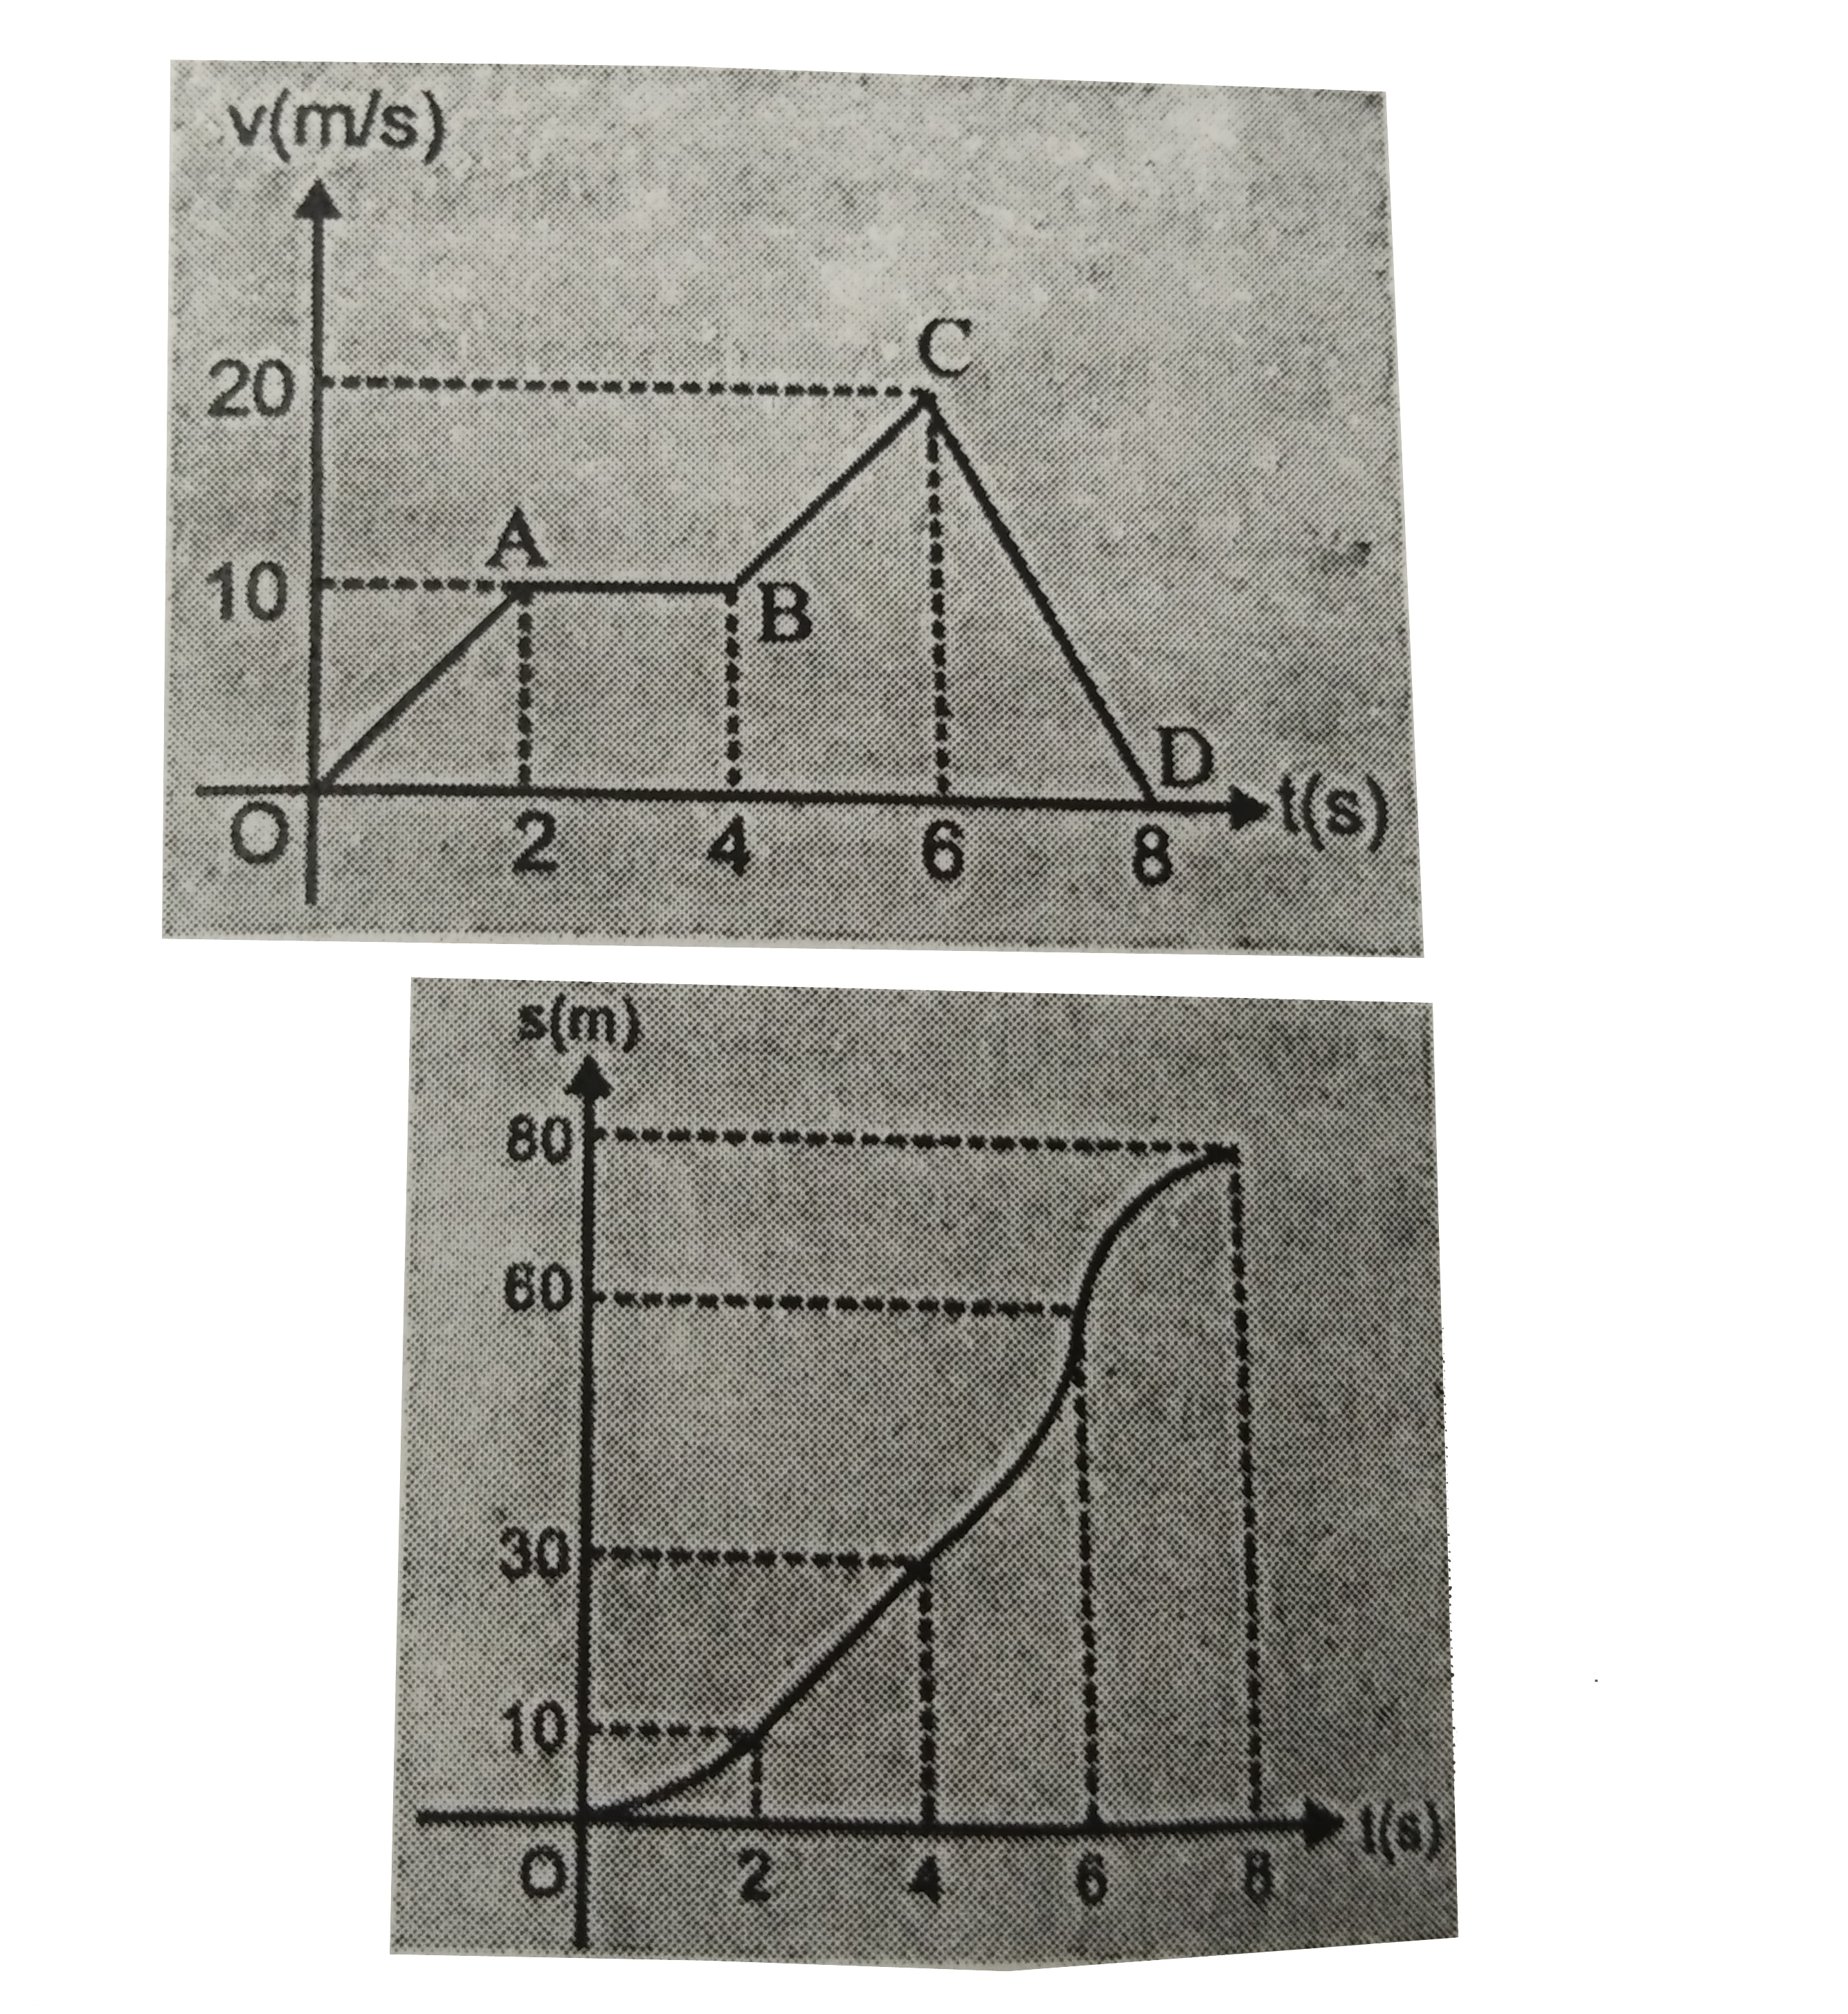
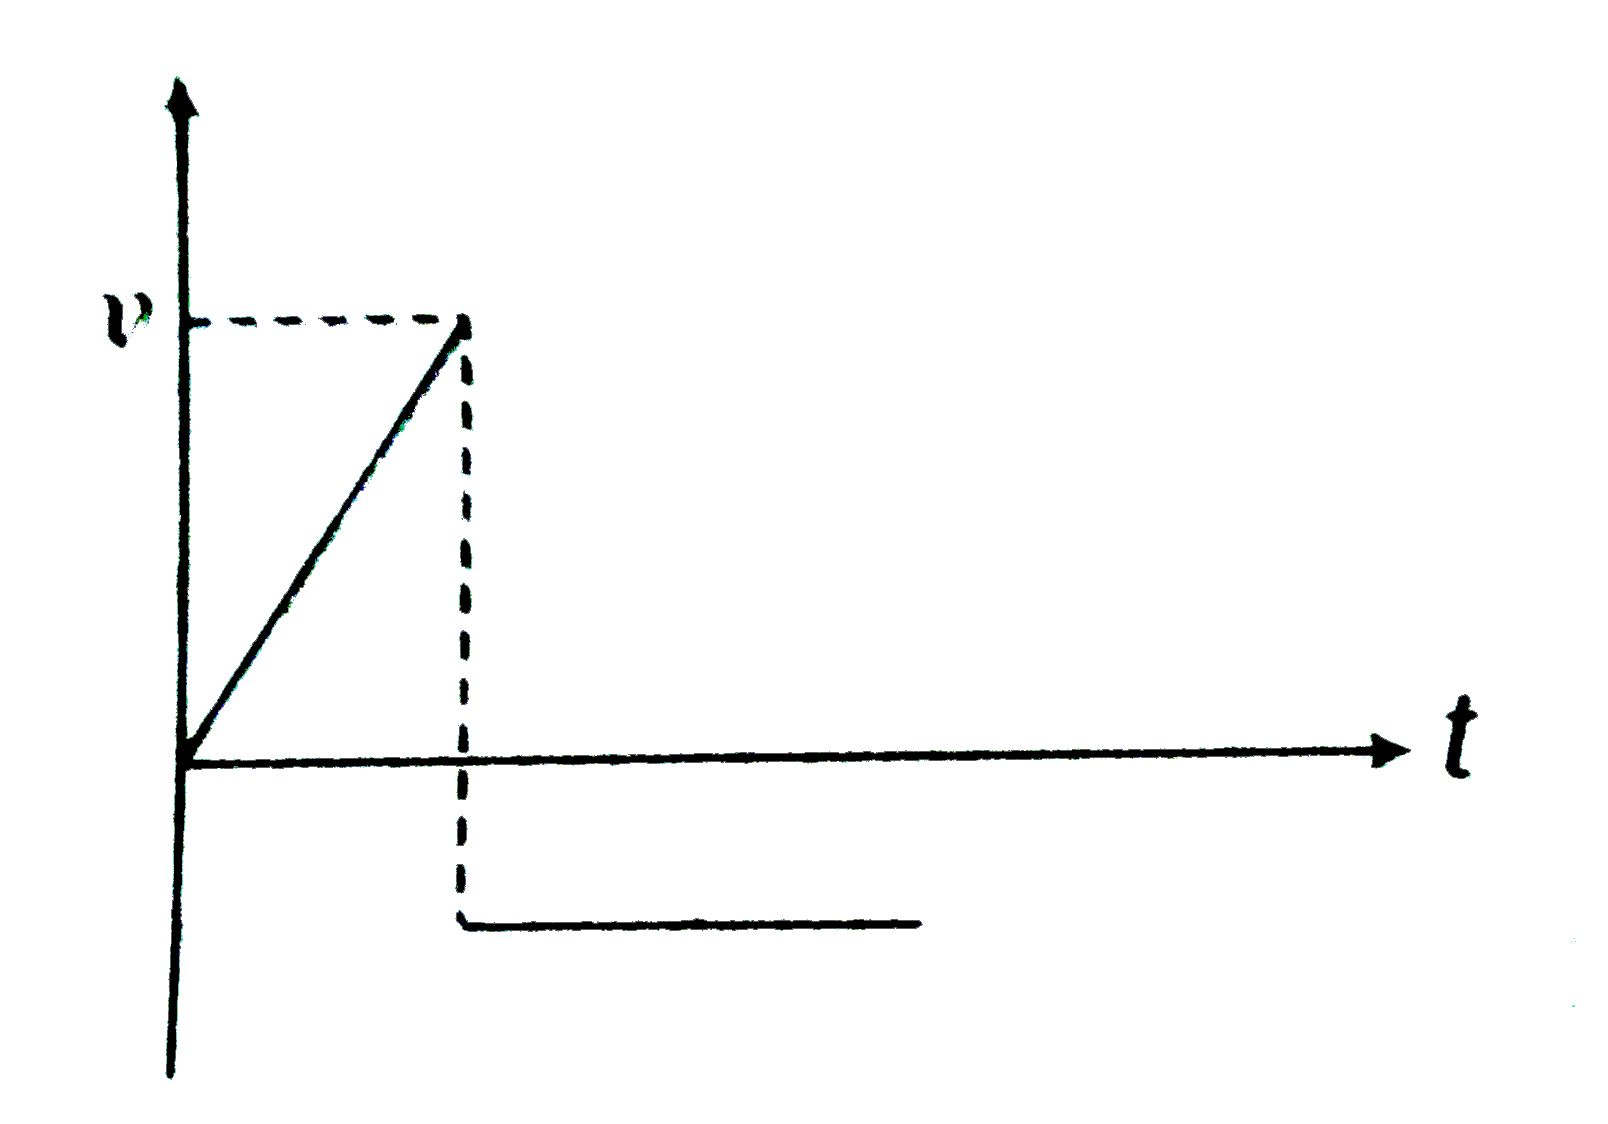
Velocity - time graph of a particle moving in a straight line is shown in figure.

Plot the corresponding displacement - time graph of the particle if at time t = 0, displacement s = 0.
Displacement = area under velocity -time graph.
Hence, sOA=12×2×10=10m
sAB=2×10=20m
or sOAB=10+20=30m
sBC=2×(10+202)=30 m
or sOABC=30+30=60m
and sCD=12(2×20)=20m
or sOABCD=60+20=80 m
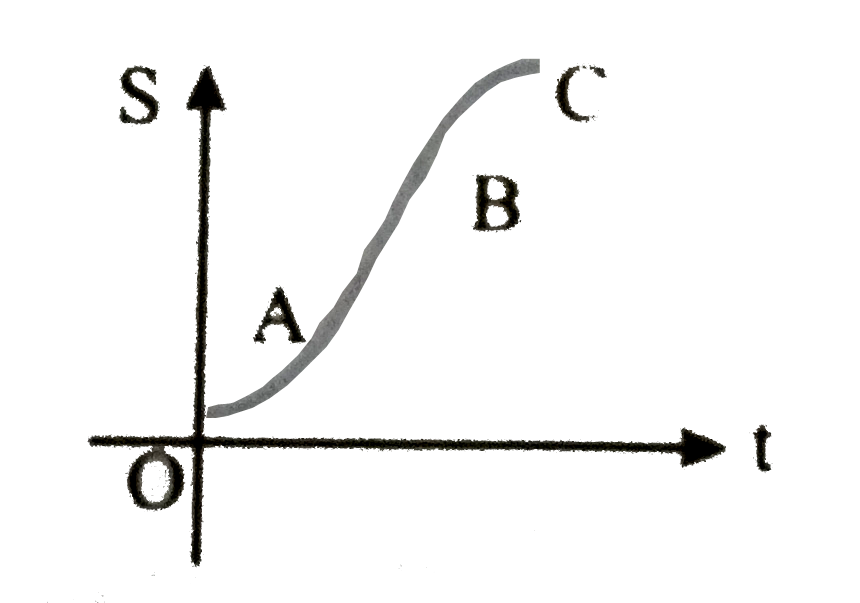
Between 0 to 2s and 4 to 6 s motion is acceleratecd, hence displacement-time graph is a parabola. Between 2 to 4 s motion is uniform, so displacement-time graph will be a straight line. Between 6 to 8 s motion is decelerated hence displacement-time graph is again a parabola but inverted in shape. At the end of 8s velocity is zero, therefore, slope of displacement-time graph should be zero. The corresponding graph is shown in the figure.
Topper's Solved these Questions
- KINEMATICS (MOTION ALONG A STRAIGHT LINE AND MOTION IN A PLANE)Book:ALLENChapter:KINEMATICS (MOTION ALONG A STRAIGHT LINE AND MOTION IN A PLANE)Exercise:BEGINNER S BOX-1
Explore 6 Videos
- KINEMATICS (MOTION ALONG A STRAIGHT LINE AND MOTION IN A PLANE)Book:ALLENChapter:KINEMATICS (MOTION ALONG A STRAIGHT LINE AND MOTION IN A PLANE)Exercise:BEGINNER S BOX-2
Explore 7 Videos
- KINEMATICSBook:ALLENChapter:KINEMATICSExercise:EXERCISE-2
Explore 89 Videos
- MISCELLANEOUSBook:ALLENChapter:MISCELLANEOUSExercise:Question
Explore 1 Video
Similar Questions
Displacement time graph of a particle moving in a straight line is a shown in figure.

View SolutionVelocity displacement graph of a particle moving in a straight line is as shown in figure.

View SolutionThe velocity time plot for a particle moving on straight line is shown in the figure.
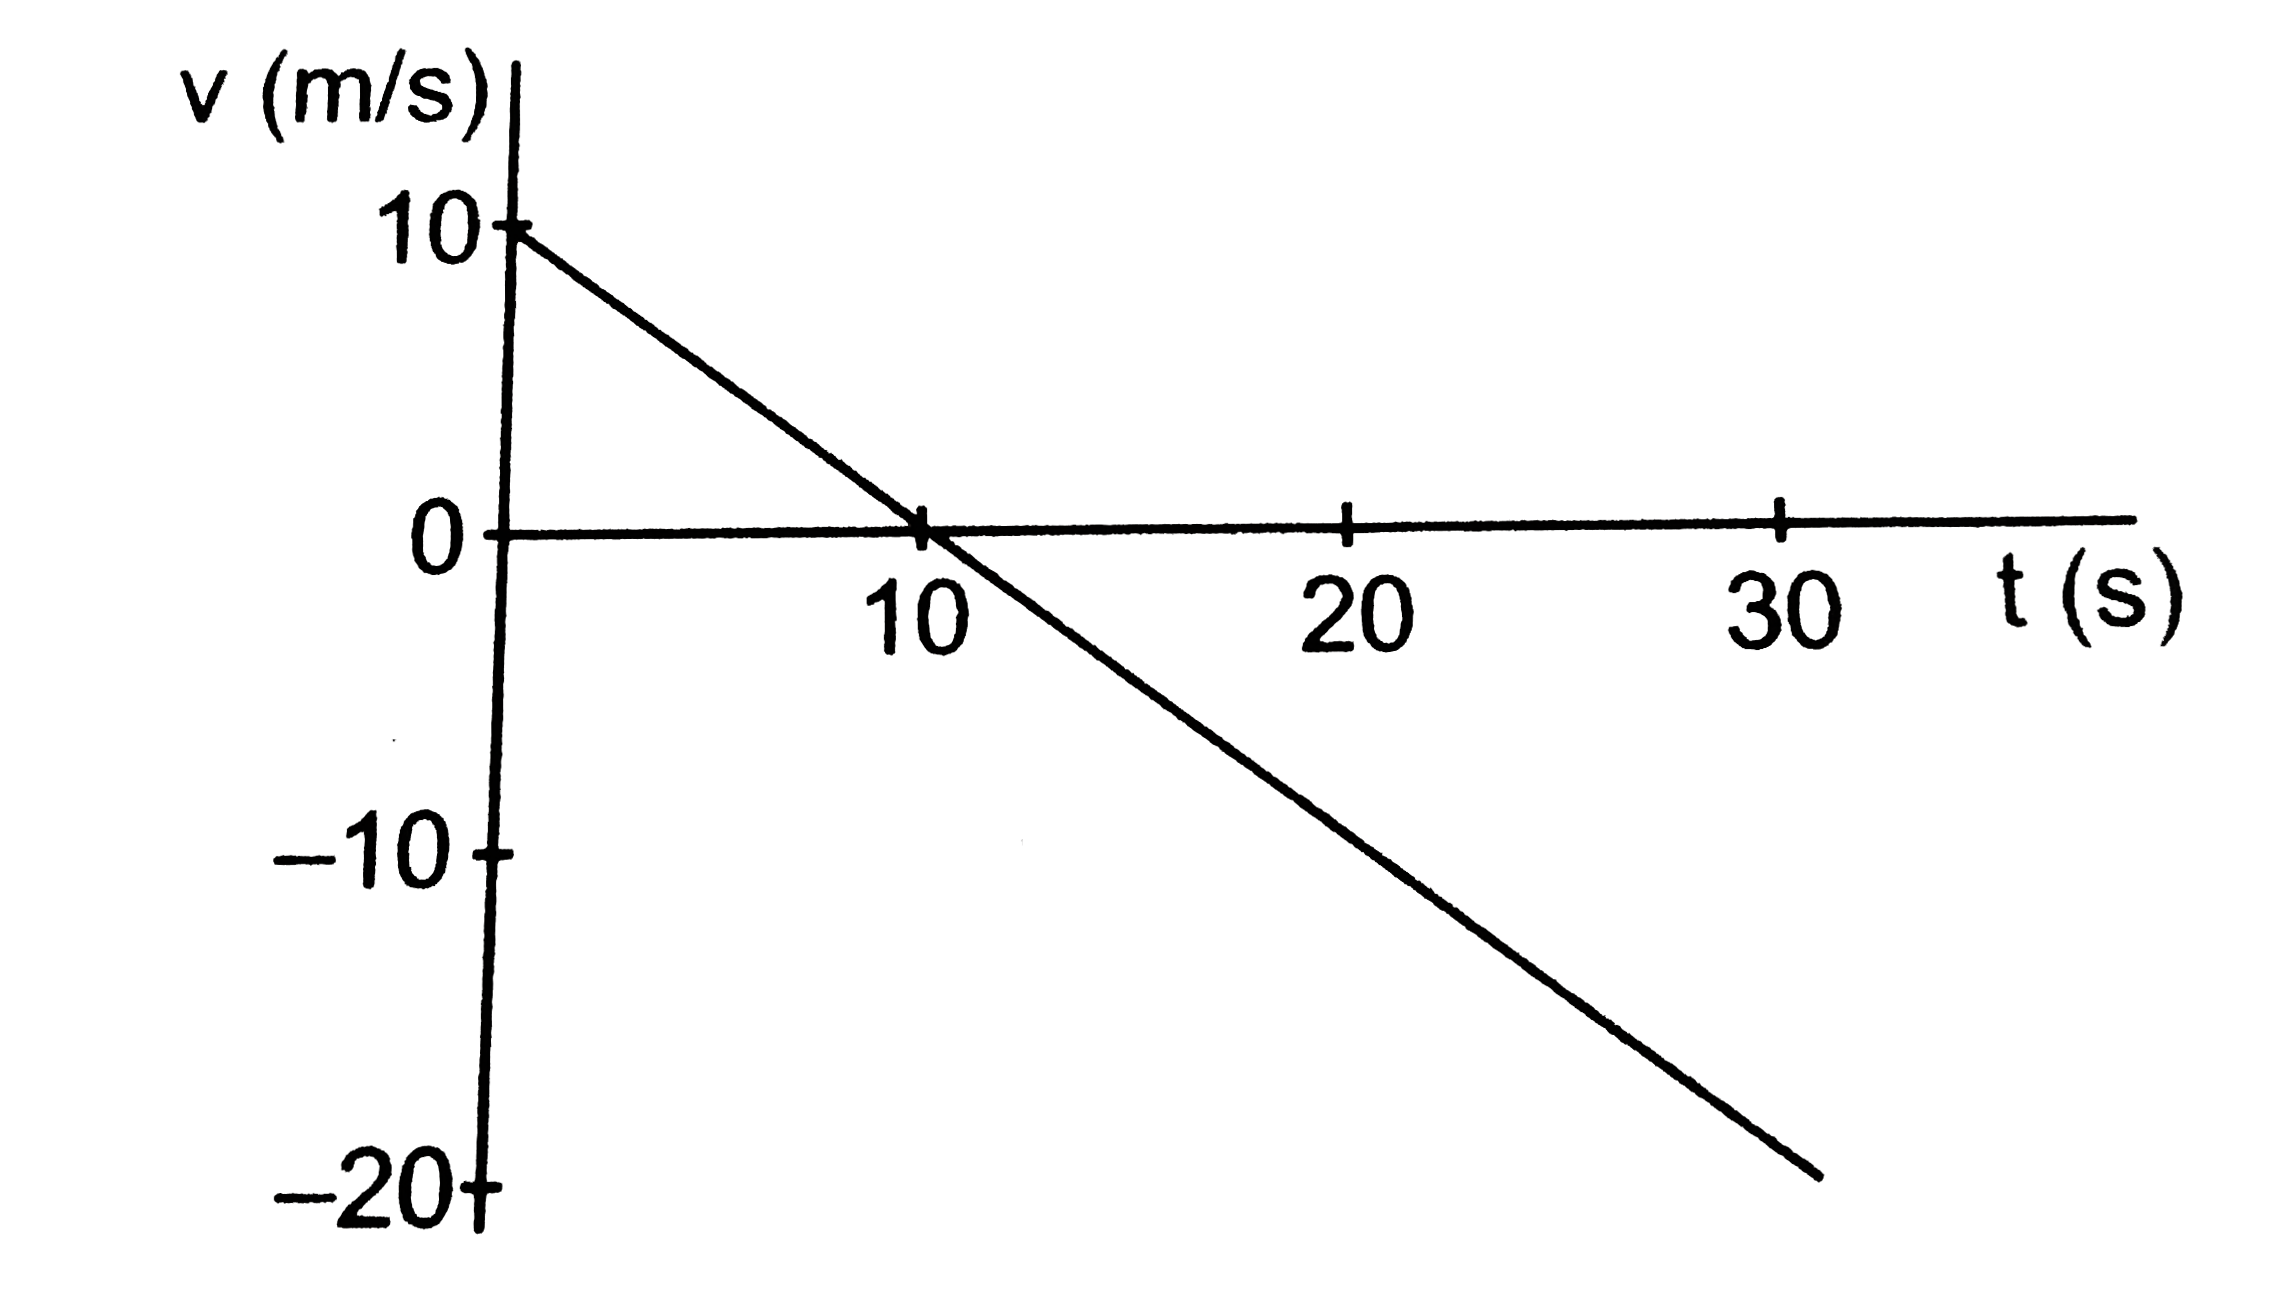
View SolutionThe velocity time plot for a particle moving on straight line is shown in the figure.

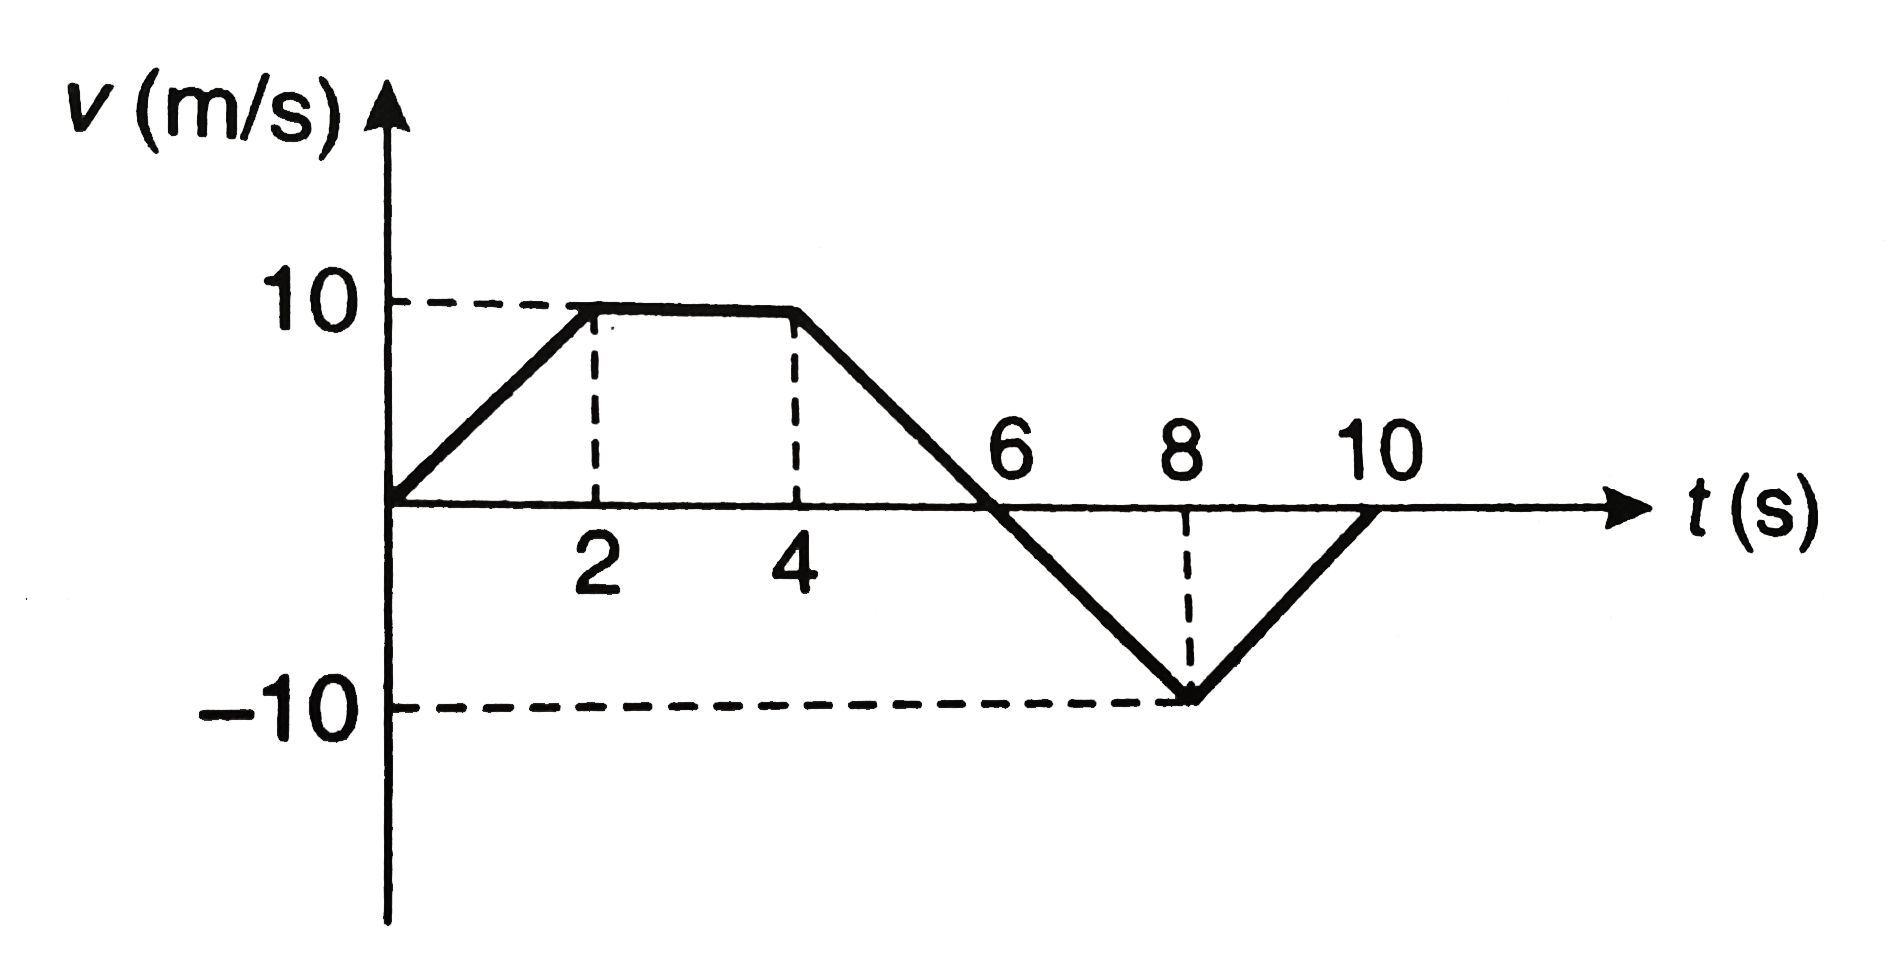
View SolutionVelocity-time graph of a particle moving in a straight line is shown in figure. At time t=0,s=−10m. Plot corresponding a-t and s-t graphs.
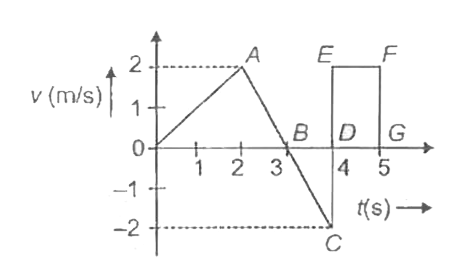
View SolutionThe velocity - time graph of a particle moving along a straight line is shown in the figure given below
The displacement of the particle in 5 second is
View Solution
The velocity displacement graph of a particle moving along a straight line is shown in figure.
Then the acceleration displacement graph is.
View SolutionThe velocity-time graph for a particle moving along X-axis is shown in the figure. The corresponding displacement-time graph is correctly shown by
View SolutionDisplacement time graph of a particle moving in a straight line is as shown in figure. Select the correct alternative (s) :
 .
.
View SolutionDisplacment-time graph of a particle moving in a straight line is as shown in figure. Choose the INCORRECT statement(s)
View Solution