A particle moves as shown in the following figure 1.104:
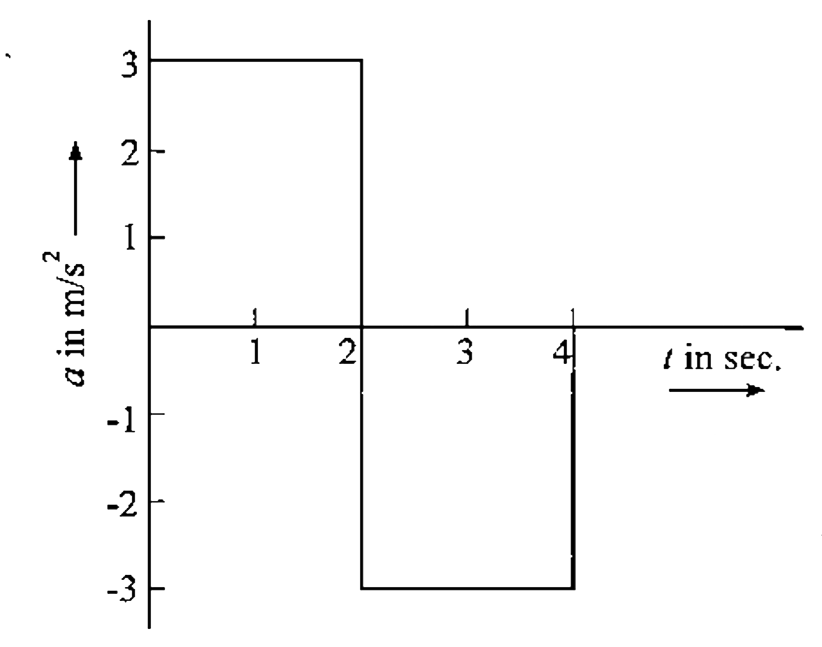
From the above curve the correct velocity-time graph for the interval of 4 seconds will be :
The correct Answer is:360km/hr,1.28km
780=usinθ×6+12×g×36
780−180=usinθ×6
using θ=6006=100m/sec
i.e. food package dropped before 10 secs
1000=u×10⇒u=100m/s
∴H=g×(16)22=1280m.
Topper's Solved these Questions
- MOTION IN A PALNEBOOK - ALLENCHAPTER - MOTION IN A PALNEEXERCISE - Exercise-04[B]
14 Videos
- MOTION IN A PALNEBOOK - ALLENCHAPTER - MOTION IN A PALNEEXERCISE - Exercise-05 [A]
11 Videos
- MOTION IN A PALNEBOOK - ALLENCHAPTER - MOTION IN A PALNEEXERCISE - Comprehension#7
3 Videos
- KINEMATICS-2DBOOK - ALLENCHAPTER - KINEMATICS-2DEXERCISE - Exercise (O-2)
46 Videos
- NEWTON'S LAWS OF MOTION & FRICTIONBOOK - ALLENCHAPTER - NEWTON'S LAWS OF MOTION & FRICTIONEXERCISE - EXERCISE (JA)
4 Videos
Similar Questions
Knowledge Check
The area under velocity-time graph for a particle in a given interval of time represnets
AvelocityBaccelerationCwork doneDDisplacement does not tell the nature of the actual motion of a particle between the points.
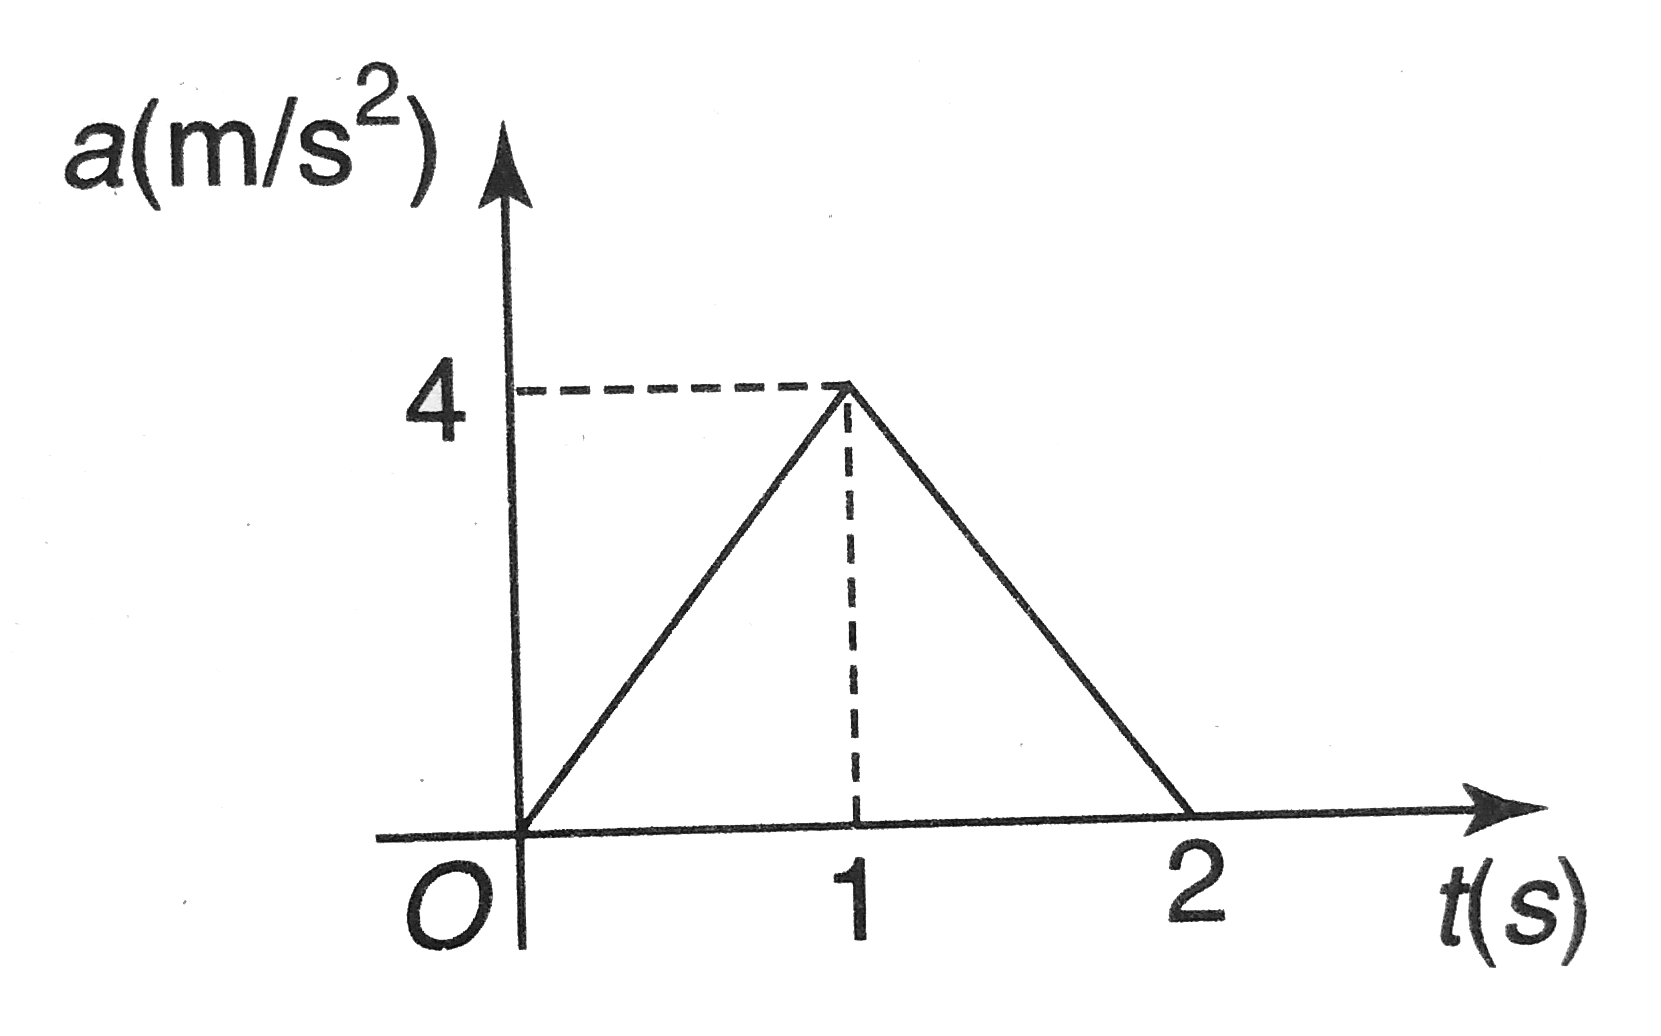
The acceleration-time graph of a particle moving in a straight line is as shown in figure. The velocity of the particle at time t=0 is 2m/s. The velocity after 2 seconds will be
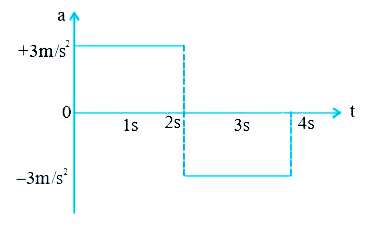
View SolutionA particle starts from rest at t=0 and undergoes an acceleration as shown in figure.
Draw the velocity-time graph of the motion of the particle during the interval from zero to 4 second.
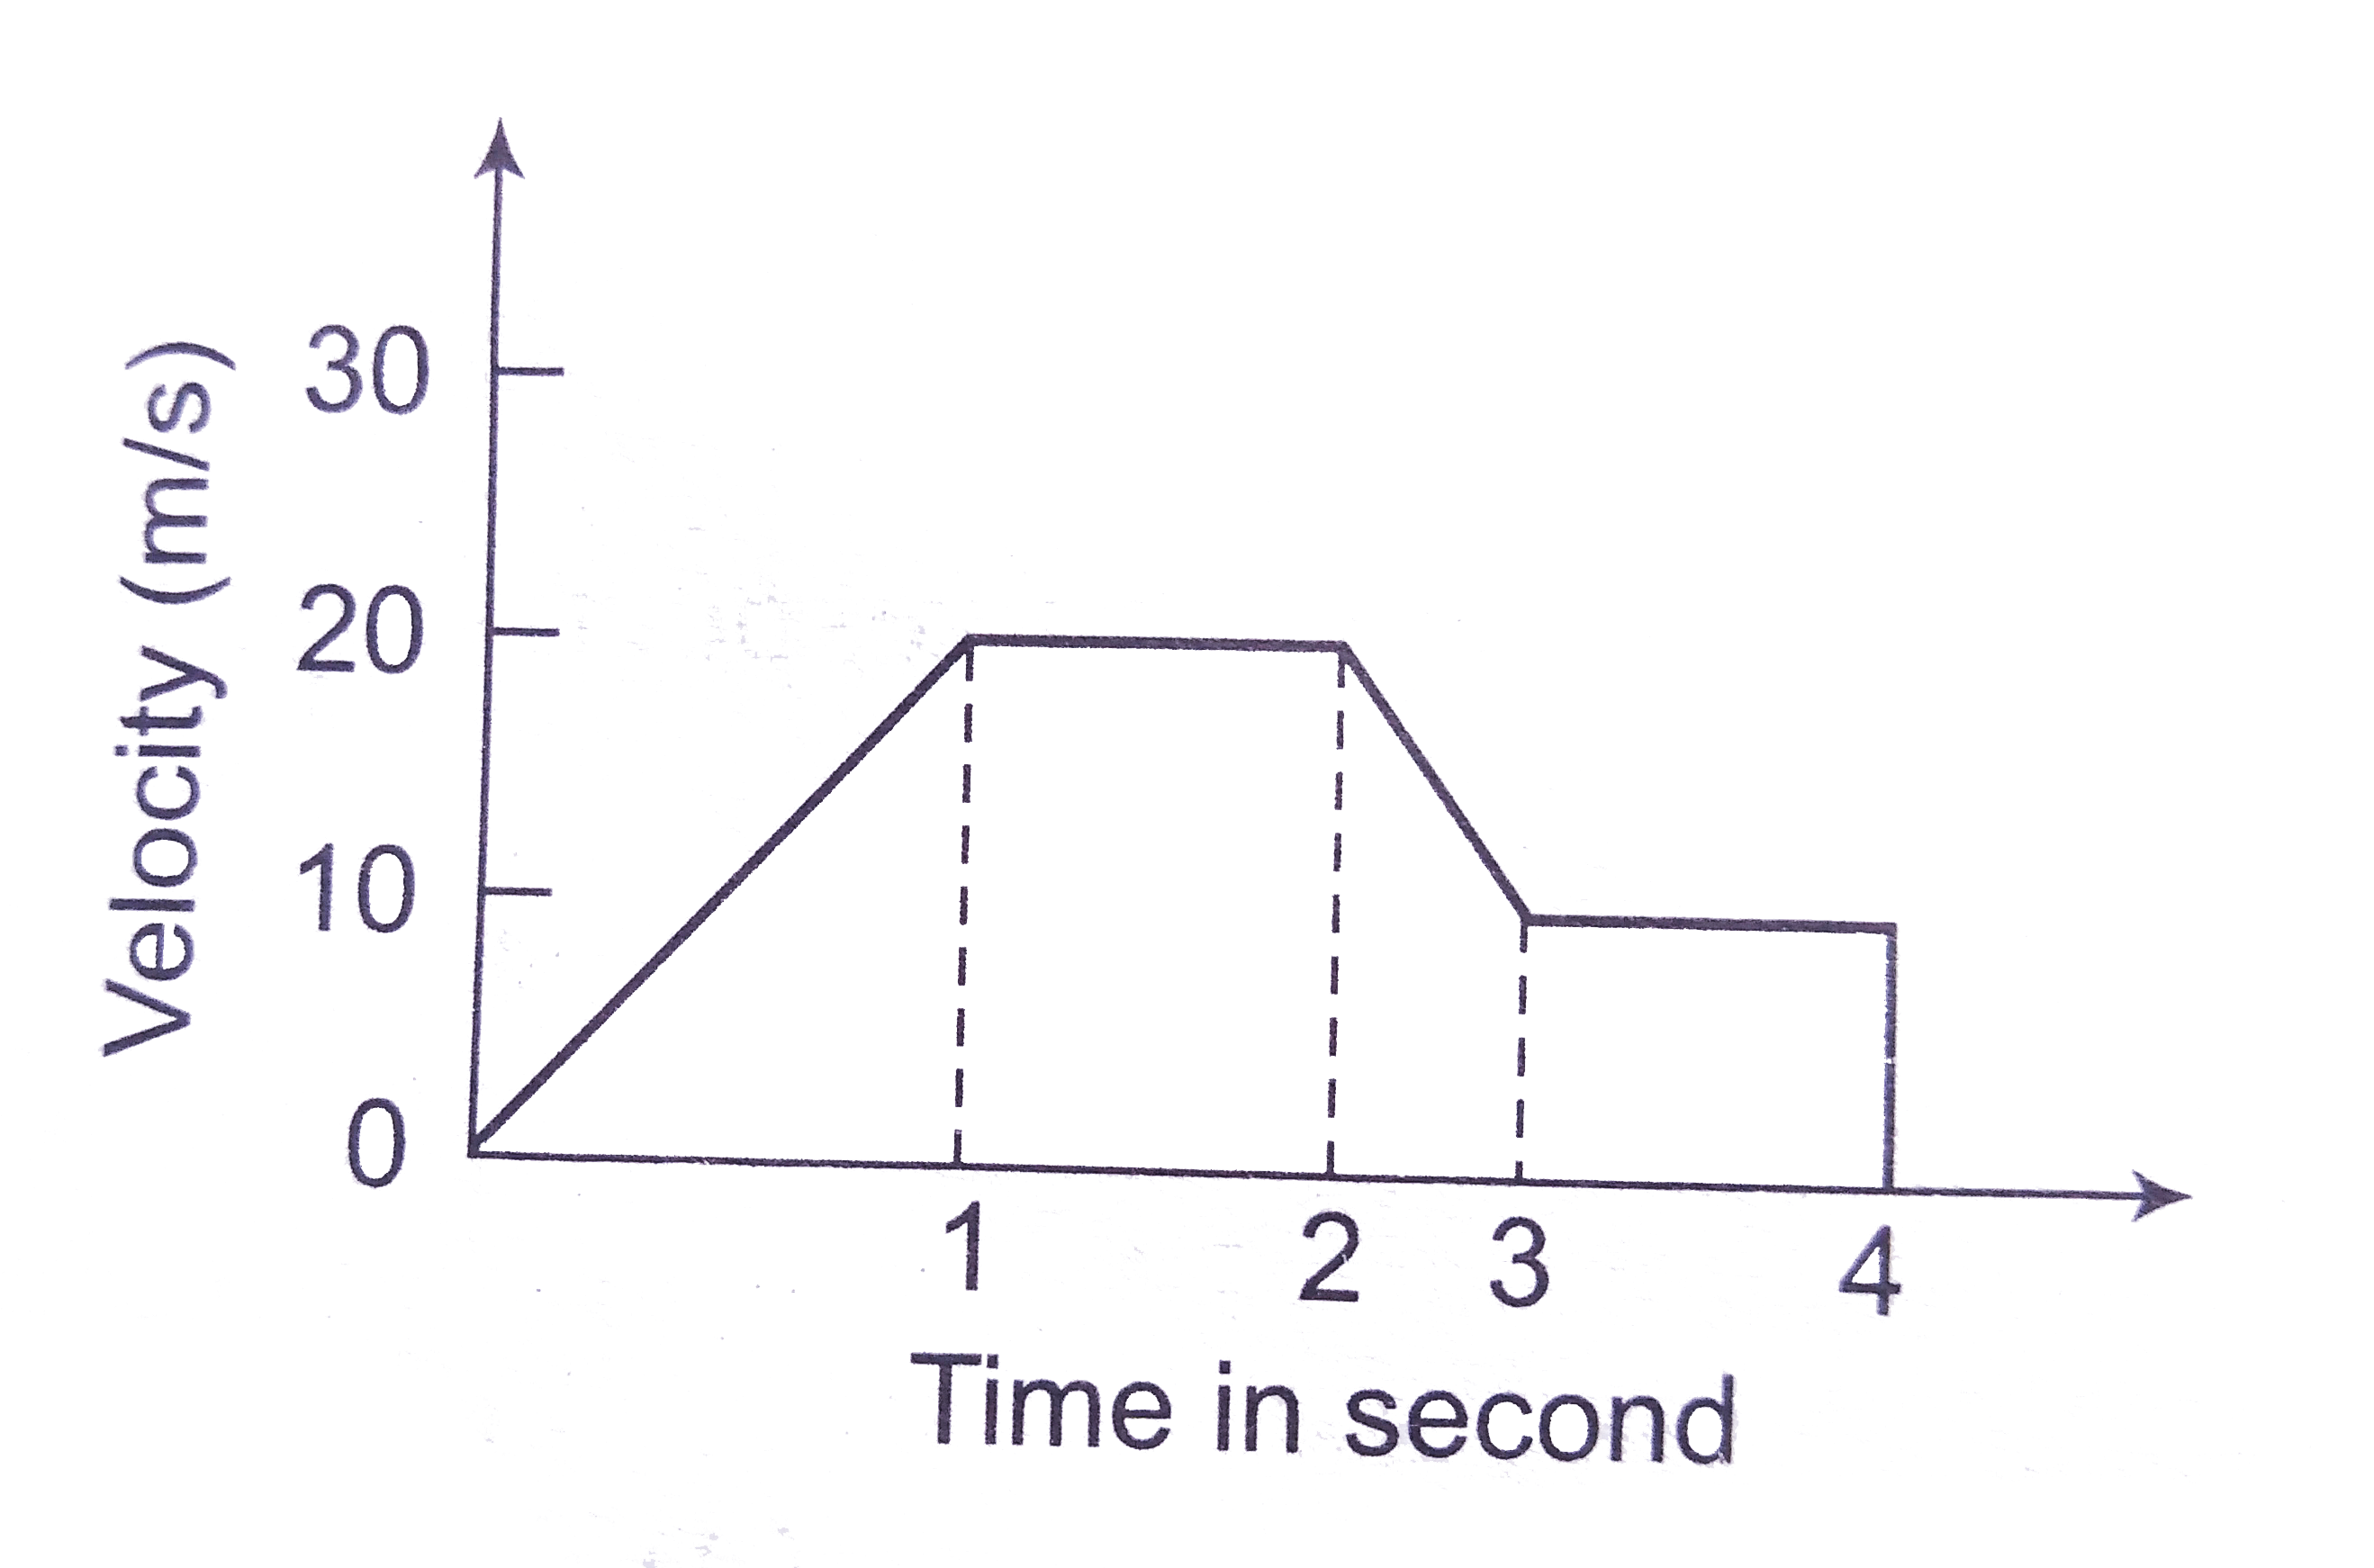
View SolutionThe variation of velocity of a particle with time moving along a straight line is illustrated in the following figure. The distance travelled by the particle in four seconds is.
View SolutionVelocity-time graph of a particle moving in a straight line is shown in figure. Plot the corresponding displacement-time graph of the particle if at time t=0, displacement s=0.
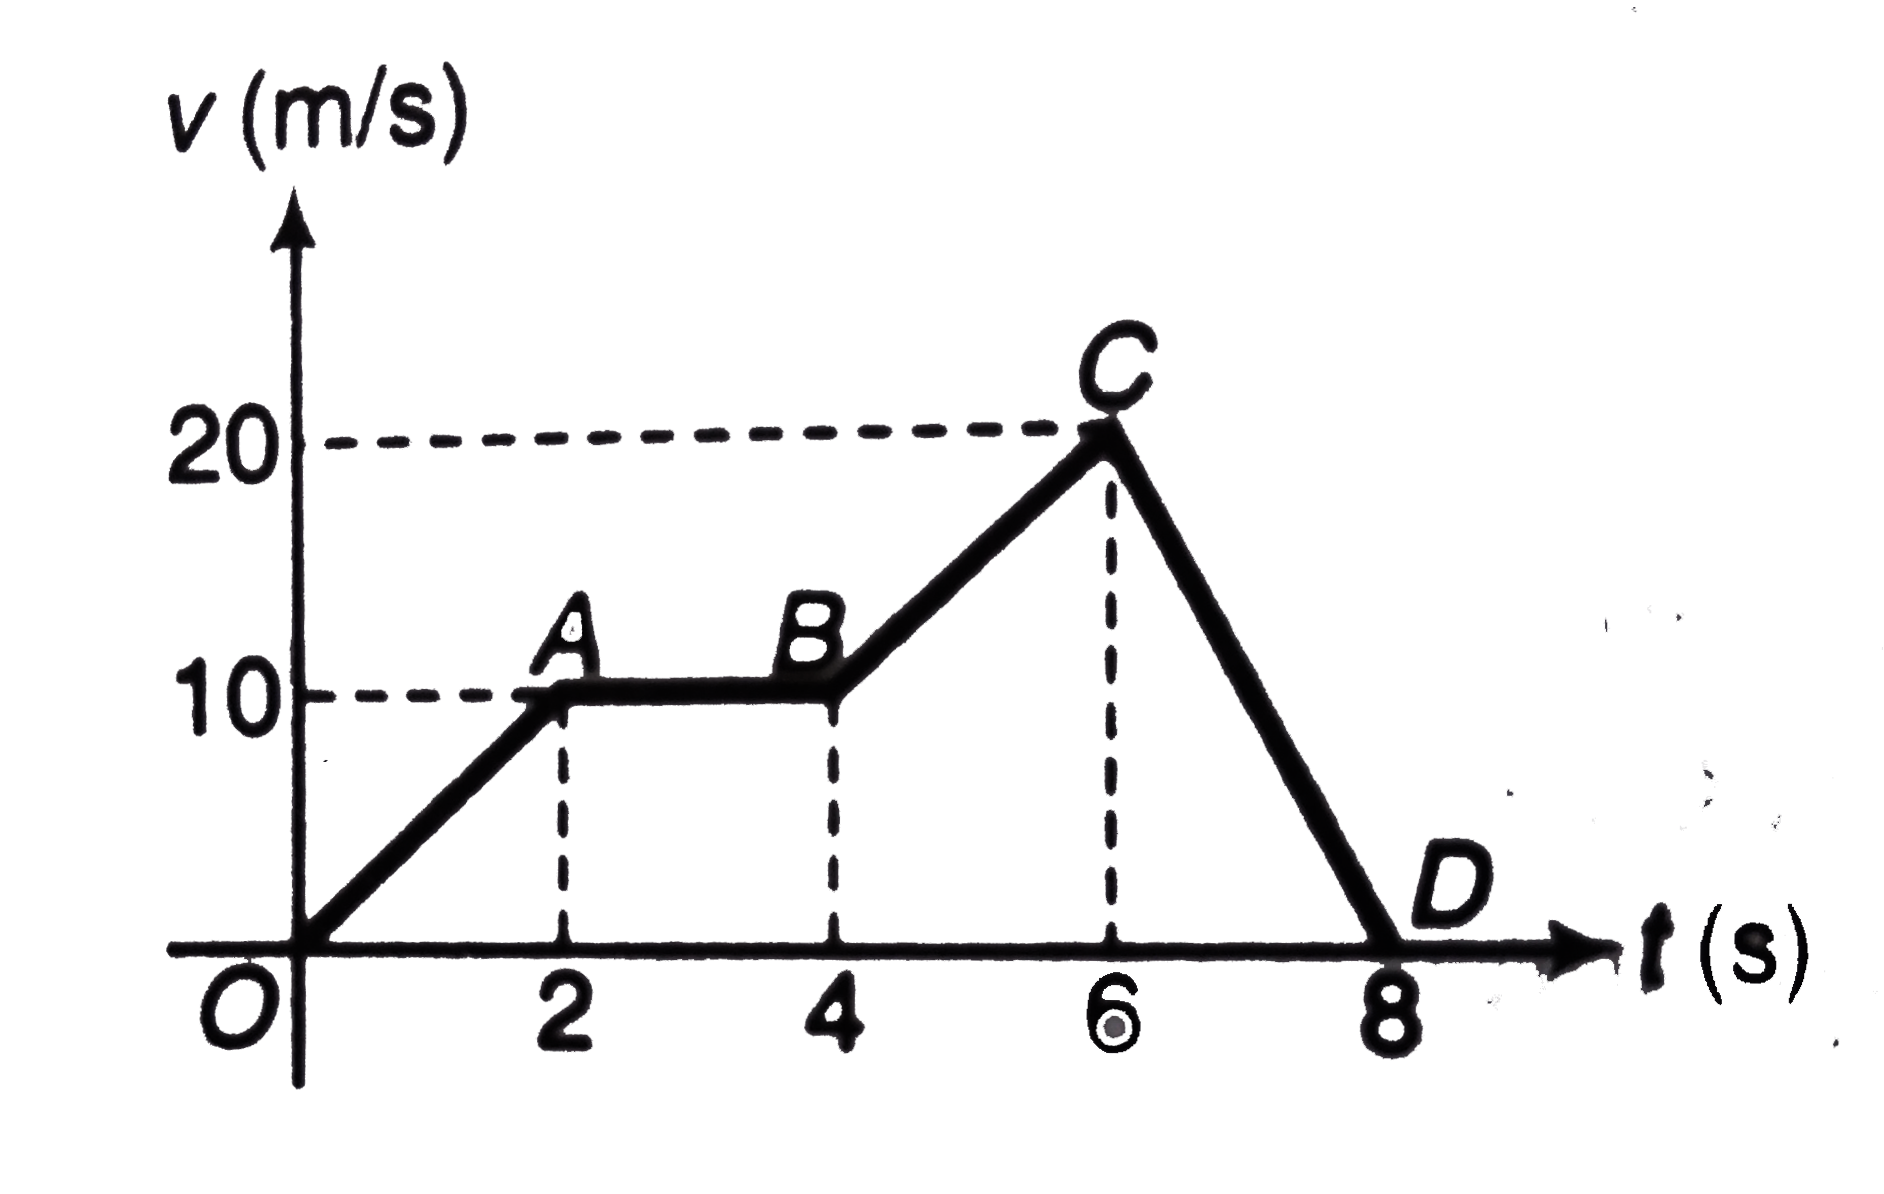
View SolutionVelocity-time graph of a particle moving in a straight line is shown in figure. Plot the corresponding displacement-time graph of the particle if at time t=0, displacement s=0.

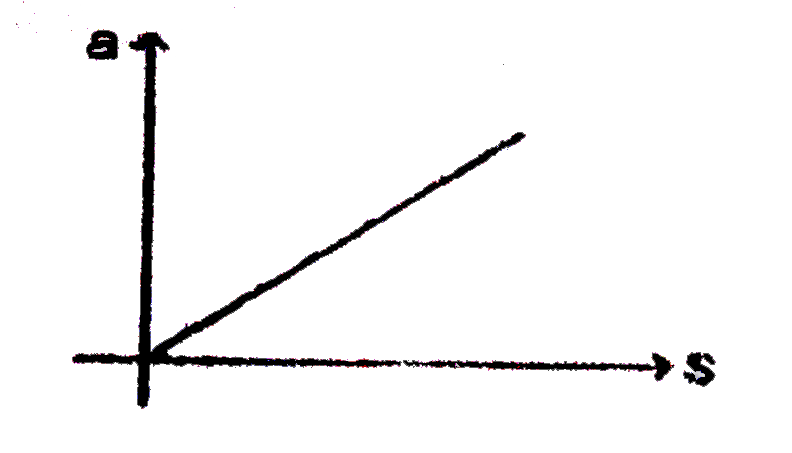
View SolutionAcceleration (a) -displacement (s) graph of a particle moving in a straight line is as shown in the figure. The initial velocity of the particle is zero. The v−s graph of the particle would be
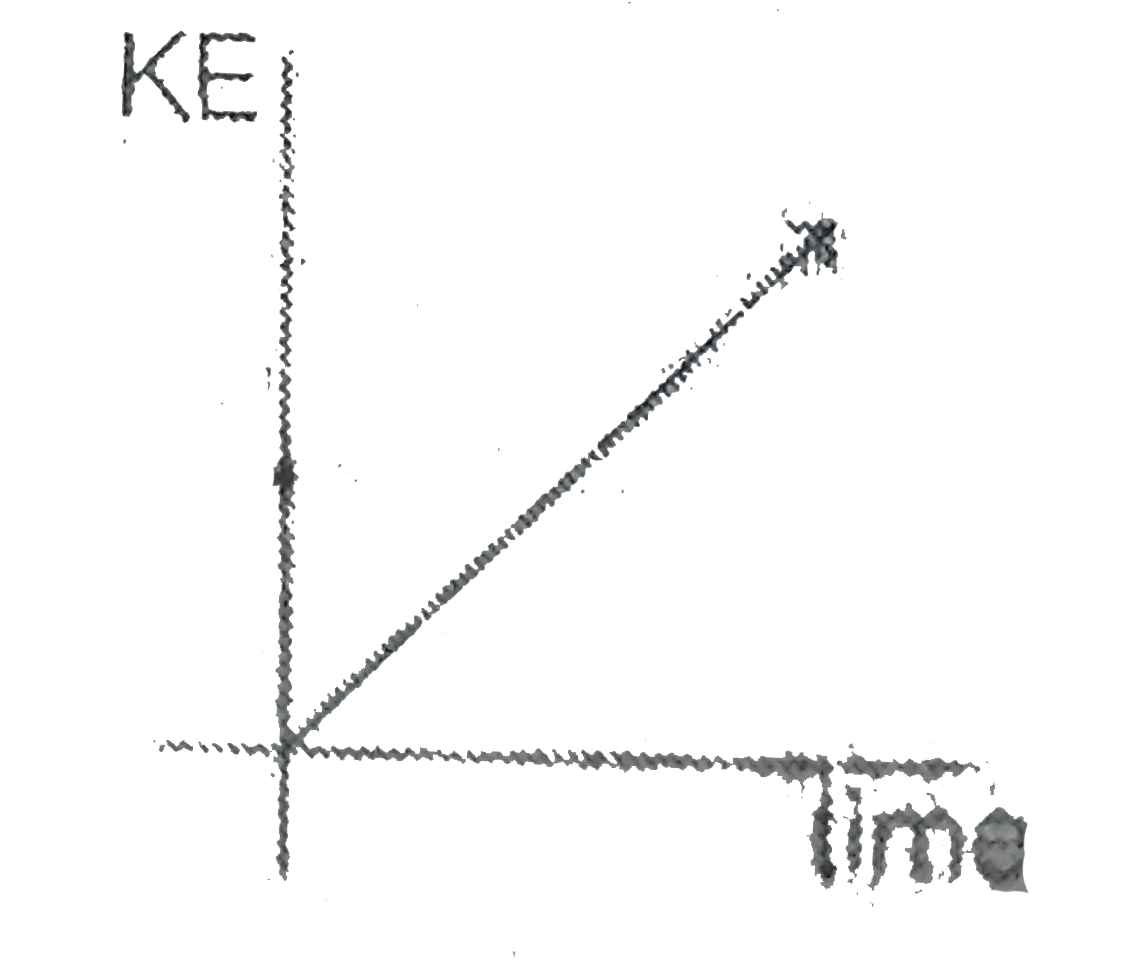
View SolutionThe kinetic energy (KE) versus time graph for a particle moving along a straight line is as shown in the figure. The force versus time graph for the particle may be
View Solution

