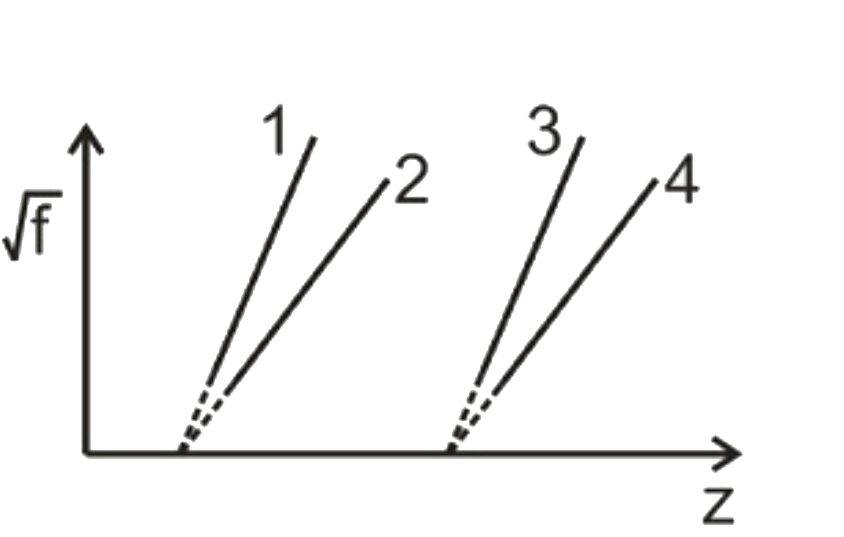
√v versus Z graph for characteristic X-rays is as shown in figure. Match the following :
_E01_127_Q01.png)
Column IColumn II(A)Line-1(p)Lα(B)Line-2(q)Lβ(C)Line-3(r)Kα(D)Line-4(s)Kβ.
The correct Answer is:(A) s (B) r (C) q (D) p
For given atomic number, energy and hence frequency of K-series is more than L-series. In one series also β-line has more energy or frequency compared to that of α− line.
Topper's Solved these Questions
- SIMPLE HARMONIC MOTIONBOOK - ALLENCHAPTER - SIMPLE HARMONIC MOTIONEXERCISE - Exercise - 05
2 Videos
- SIMPLE HARMONIC MOTIONBOOK - ALLENCHAPTER - SIMPLE HARMONIC MOTIONEXERCISE - Exercise - 06
2 Videos
- SIMPLE HARMONIC MOTIONBOOK - ALLENCHAPTER - SIMPLE HARMONIC MOTIONEXERCISE - Exercise - 03
2 Videos
- RACEBOOK - ALLENCHAPTER - RACEEXERCISE - Basic Maths (Wave Motion & Dopplers Effect) (Stationary waves & doppler effect, beats)
24 Videos
- TEST PAPERBOOK - ALLENCHAPTER - TEST PAPEREXERCISE - PHYSICS
4 Videos
Similar Questions
Knowledge Check
Match the rate law given in column I with the dimensions of rate constants given in column II and mark the appropriate choice.
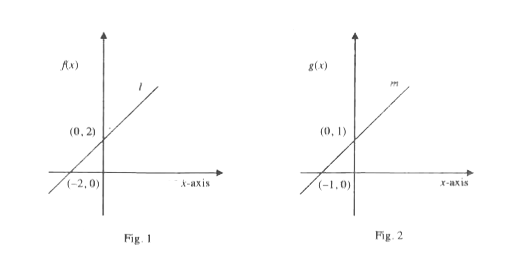
Column IColumn II(A)Rate=k[NH3]0(i)molL−1s−1(B)Rate=k[H2O2][I−](ii)Lmol−1s−1(C)Rate=k[CH3CHO]3/2(iii)S−1(D)Rate=k[C5H5CI](iv)L1/2mol−1/2s−1A(A) → (iv), (B) → (iii), (C ) → (ii), (D) → (i)B(A) → (i), (B) → (ii) (C ) → (iv) ,(D) → (iii)C(A) → (iii), (B) → (ii) (C ) → (i) ,(D) → (iv)D(A) → (ii), (B) → (i), (C ) → (vi), (D) → (iii)Column AIn the two figure shown.line l represent the function f and line m represents the function g.ColumnBf(10)g(10)
 AIf column A is largerBIf column B is largerCIf the columns are equalDIf there is not enough information to decide
Match Column - I with Column - II

PQRS(A)1243(B)2143(C)4132(D)4321
View SolutionIn normal YDSE experiment maximum intensity is 4I0 in Column I, y-coordinate is given corresponding to centre line In Coloum II resultant intensities are given Match the two columns.
Column IColumn IIAy=λDdp.I=I0By=λD2dq.I=2I0Cy=λD3dr.I=4I0Dy=λD4ds.I=zero
View SolutionColumn I shows distributionof electric field liness and column II shows charge distribution . Match the columns.
Column I Column II(A)Straight lines but not parallel(p)Uniformly distributed charged shell(B)Straight lines but parallel (q)Uniformly distributed charged long rod(C)Curved lines(r)Uniformly distributed infinite charged sheet(D)Some regions where no lines are present(s)Electric dipole(t)Any conducting material
View SolutionThe graph given below, shows the variation of √f vs z for characteristics X- rays. Lines 1,2,3 and 4 shown in the graph corresponds to any one of Kα,Kβ,Lα,Lβ emission, then Lβ is represented by ( f = frequency, z = Atomic number)

View SolutionIf α,β,γ be the roots of the equation x(1+x2)+x2(6+x)+2=0 then match the entries of column-I with those of column-II.
column-I Column -II(A) α−1+β−1+γ−1 is equal to (p) 8(B)α2+β2+γ2 equals(q)−12(C)(α−1+β−1+γ−1)−(α+β+γ) is equal to (r) -1(D)[α−1+β−1+γ−1] equals where [.] denotes the greatest integer equal to (t)52
View SolutionMatch the following columns,
Column1Column2a Thermal resitancep [MT^(-3)K^(-4)]b Stefan's constantq [M^(-1)L^(-2)T^(3)K]c Wien's constantr [ML^(2)T^(-3)]d Heat currents [LK]
View Solution


