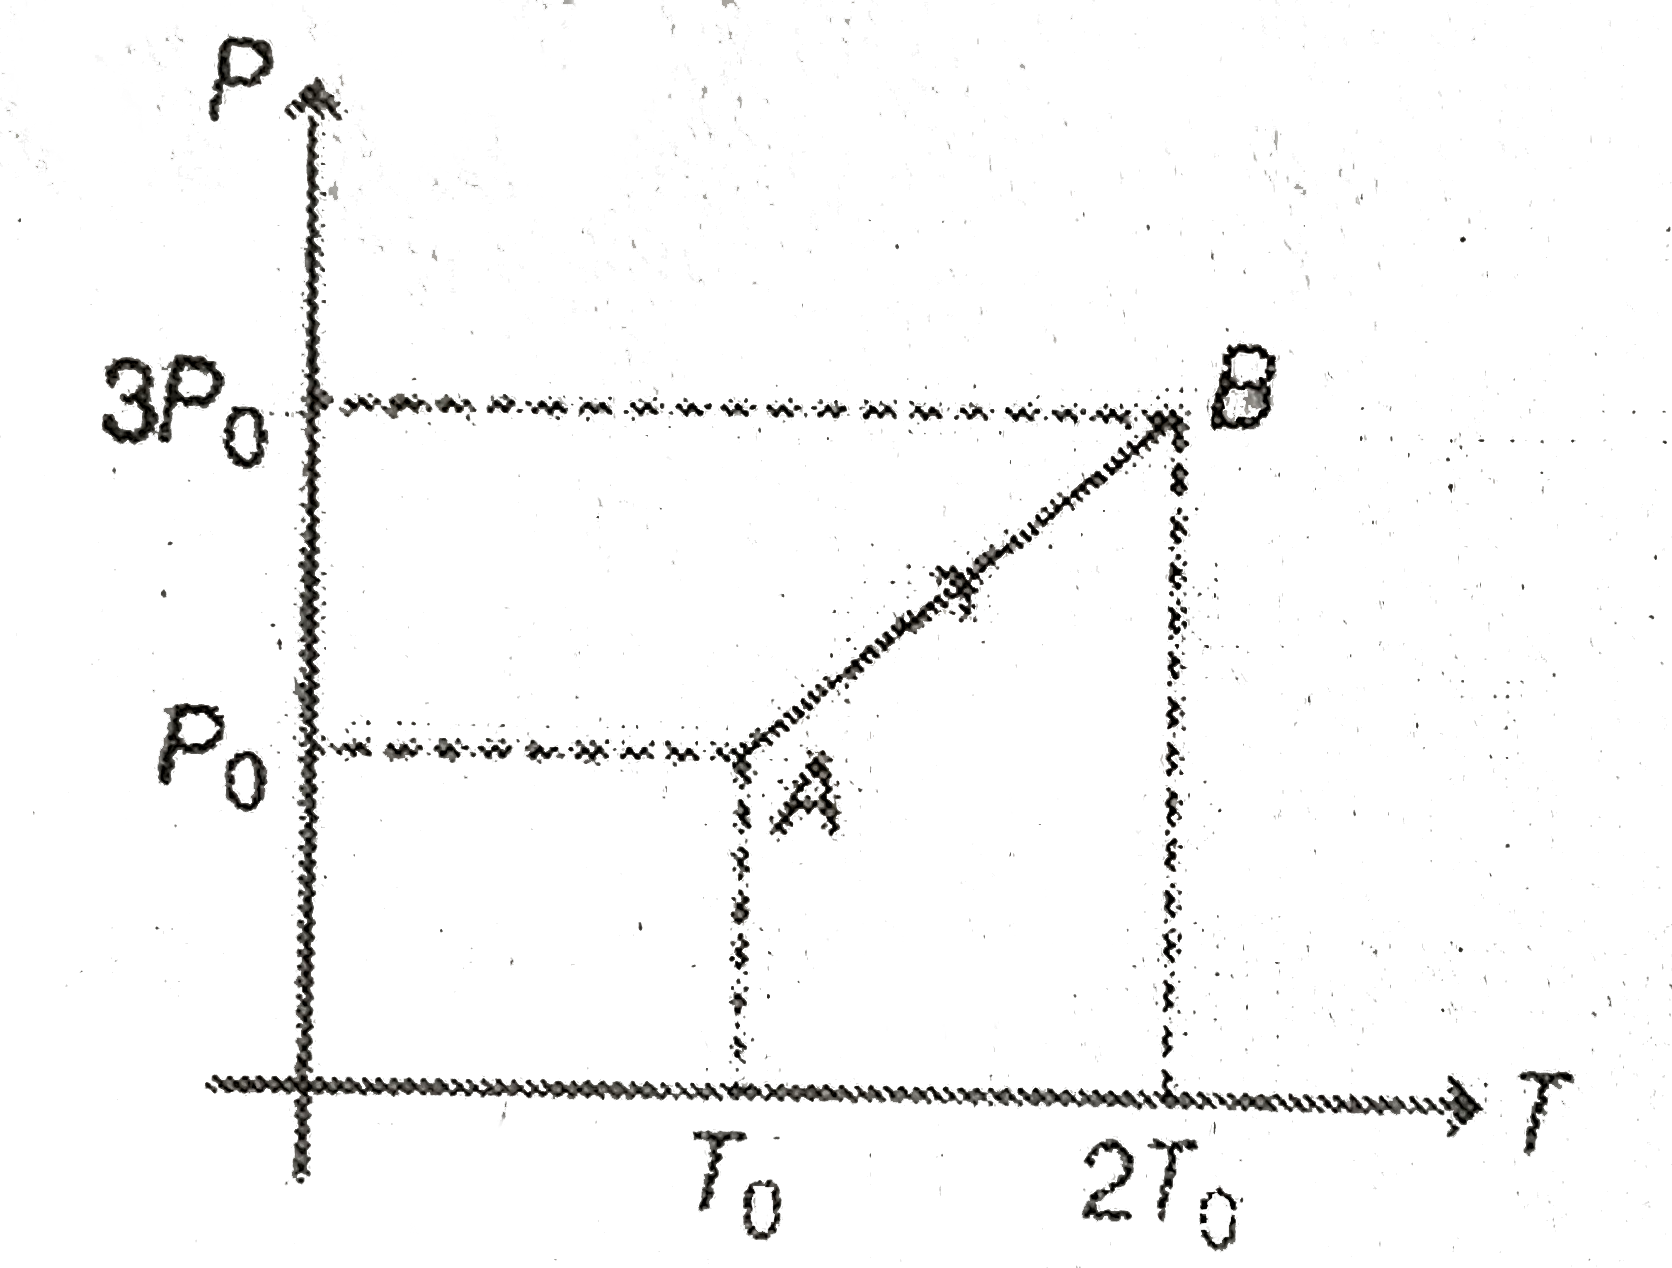
Pressure versus temperature graph of an ideal gas is as shown in figure. Density of the gas at point A is ρ0. Density at B will be
34ρ0
32ρ0
43ρ0
2ρ0
The correct Answer is:B
Ideal gas equation P=ρMRT
For state A :
P0=ρ0MRT0
For state B 3P0=ρMR2T0⇒ρ=32ρ0
Topper's Solved these Questions
- GEOMETRICAL OPTICSBOOK - ALLENCHAPTER - GEOMETRICAL OPTICSEXERCISE - EXERCISE -03
10 Videos
- GEOMETRICAL OPTICSBOOK - ALLENCHAPTER - GEOMETRICAL OPTICSEXERCISE - ASSERTION-REASON
36 Videos
- GEOMETRICAL OPTICSBOOK - ALLENCHAPTER - GEOMETRICAL OPTICSEXERCISE - EXERCISE -01
65 Videos
- CURRENT ELECTRICITYBOOK - ALLENCHAPTER - CURRENT ELECTRICITYEXERCISE - EX.II
66 Videos
- GRAVITATIONBOOK - ALLENCHAPTER - GRAVITATIONEXERCISE - EXERCISE 4
9 Videos
Similar Questions
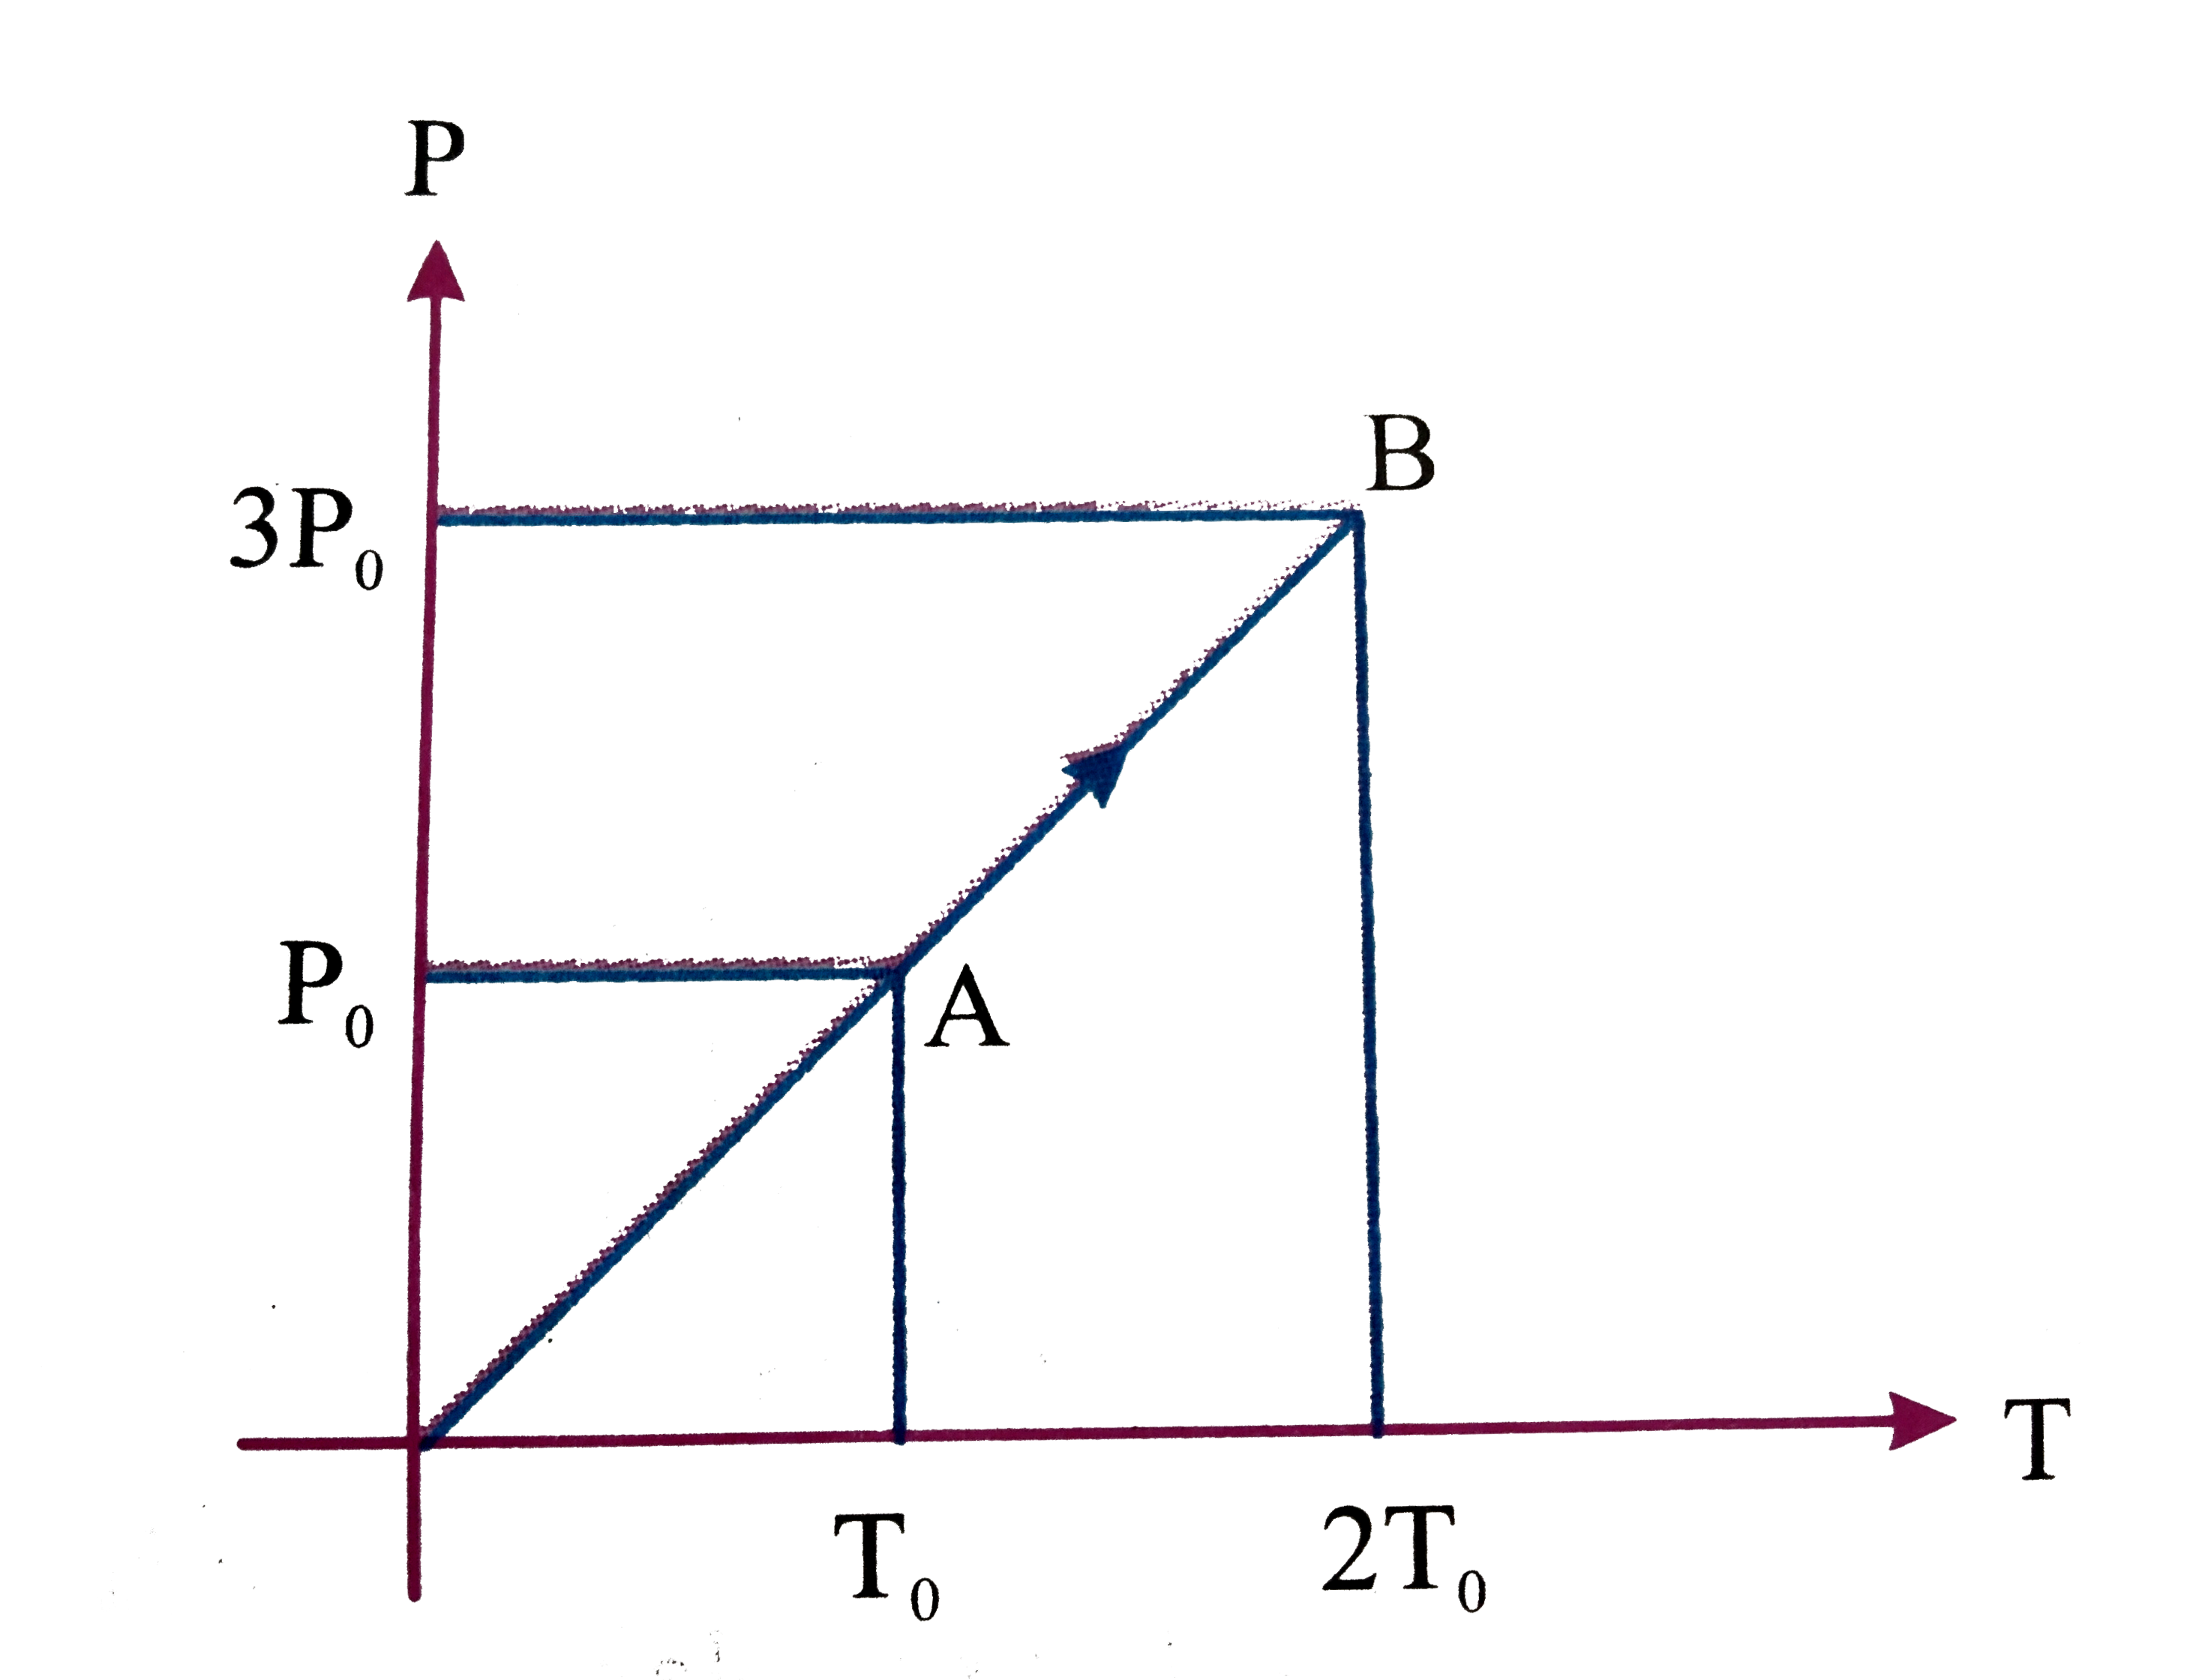
Pressure versus temperature graph of an ideal gas is shown in figure. Density of the gas at point A is ρ0. Density at B will be
View SolutionIn figure shown,Pressure versus temperature graph of an ideal gas is as . Density of the gas at point A is ρ0 . Density at point B will be ____
View SolutionPressure versus temperature graphs of an ideal gas are as shown in figure. Choose the wrong statement
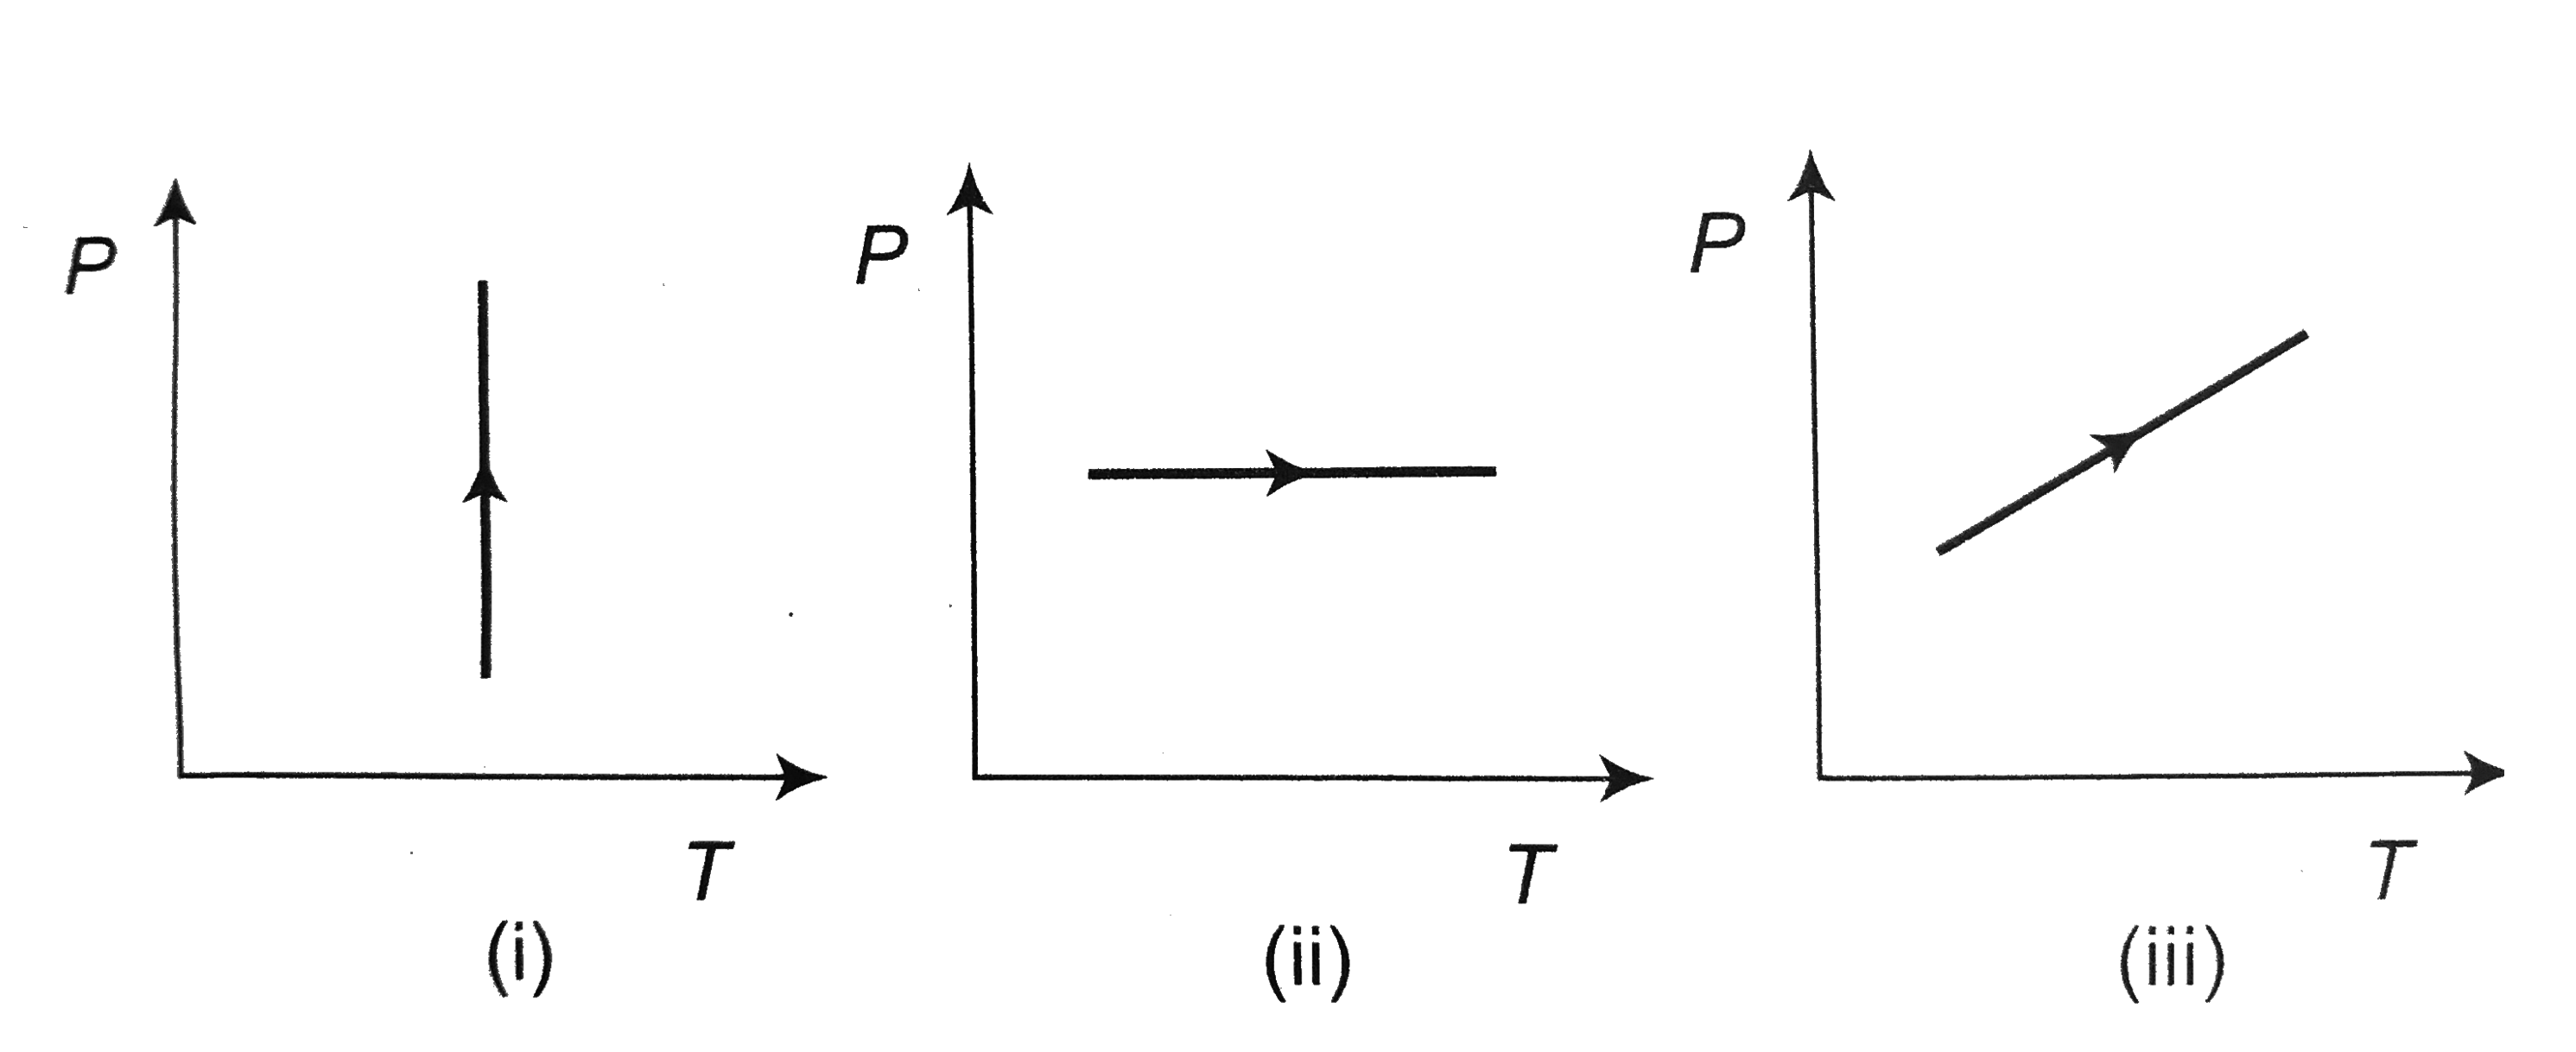
View SolutionPressure versus temperature graphs of an ideal gas are as shown in figure. Choose the wrong statement

View SolutionPressure versus density graph of an ideal gas is shown in figure
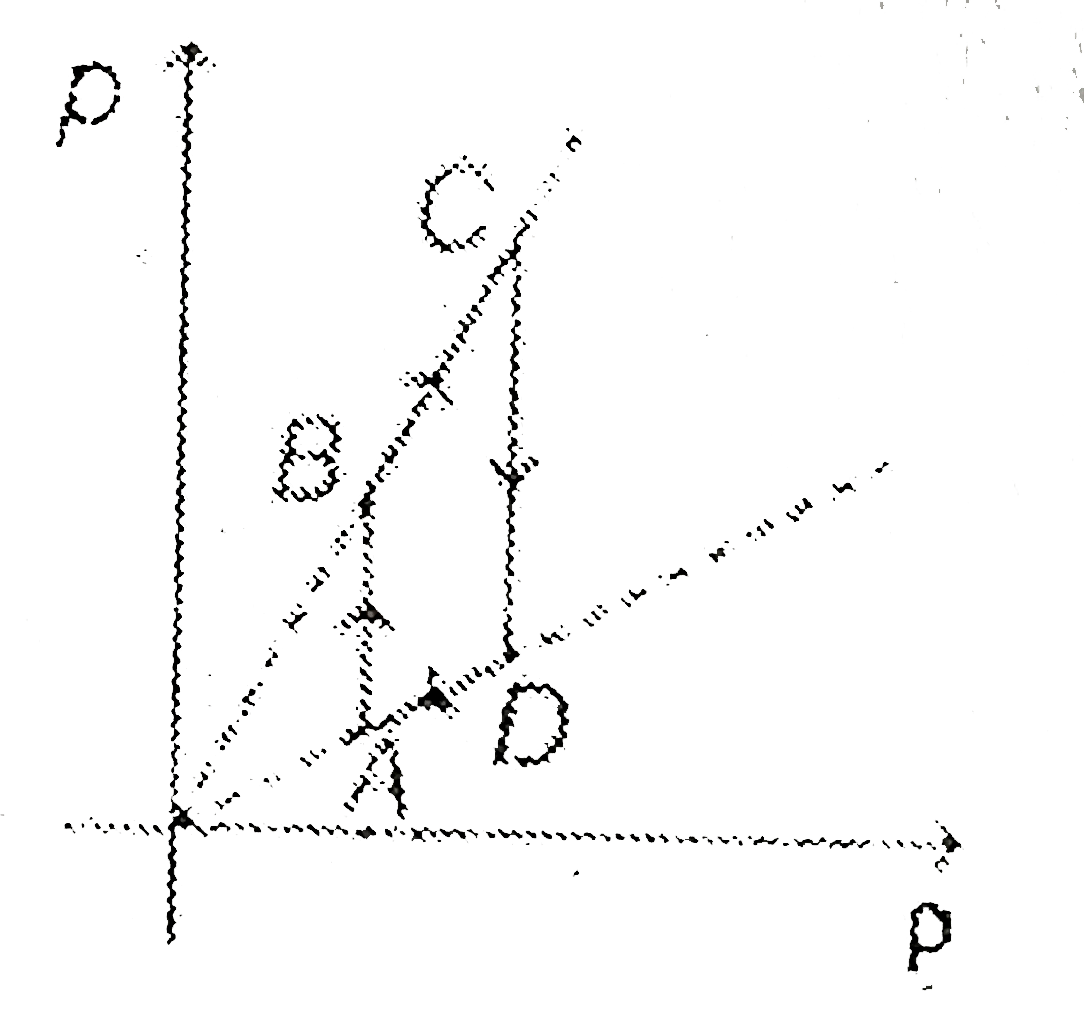
View Solutiongraph of an ideal gas is as shown in figure.
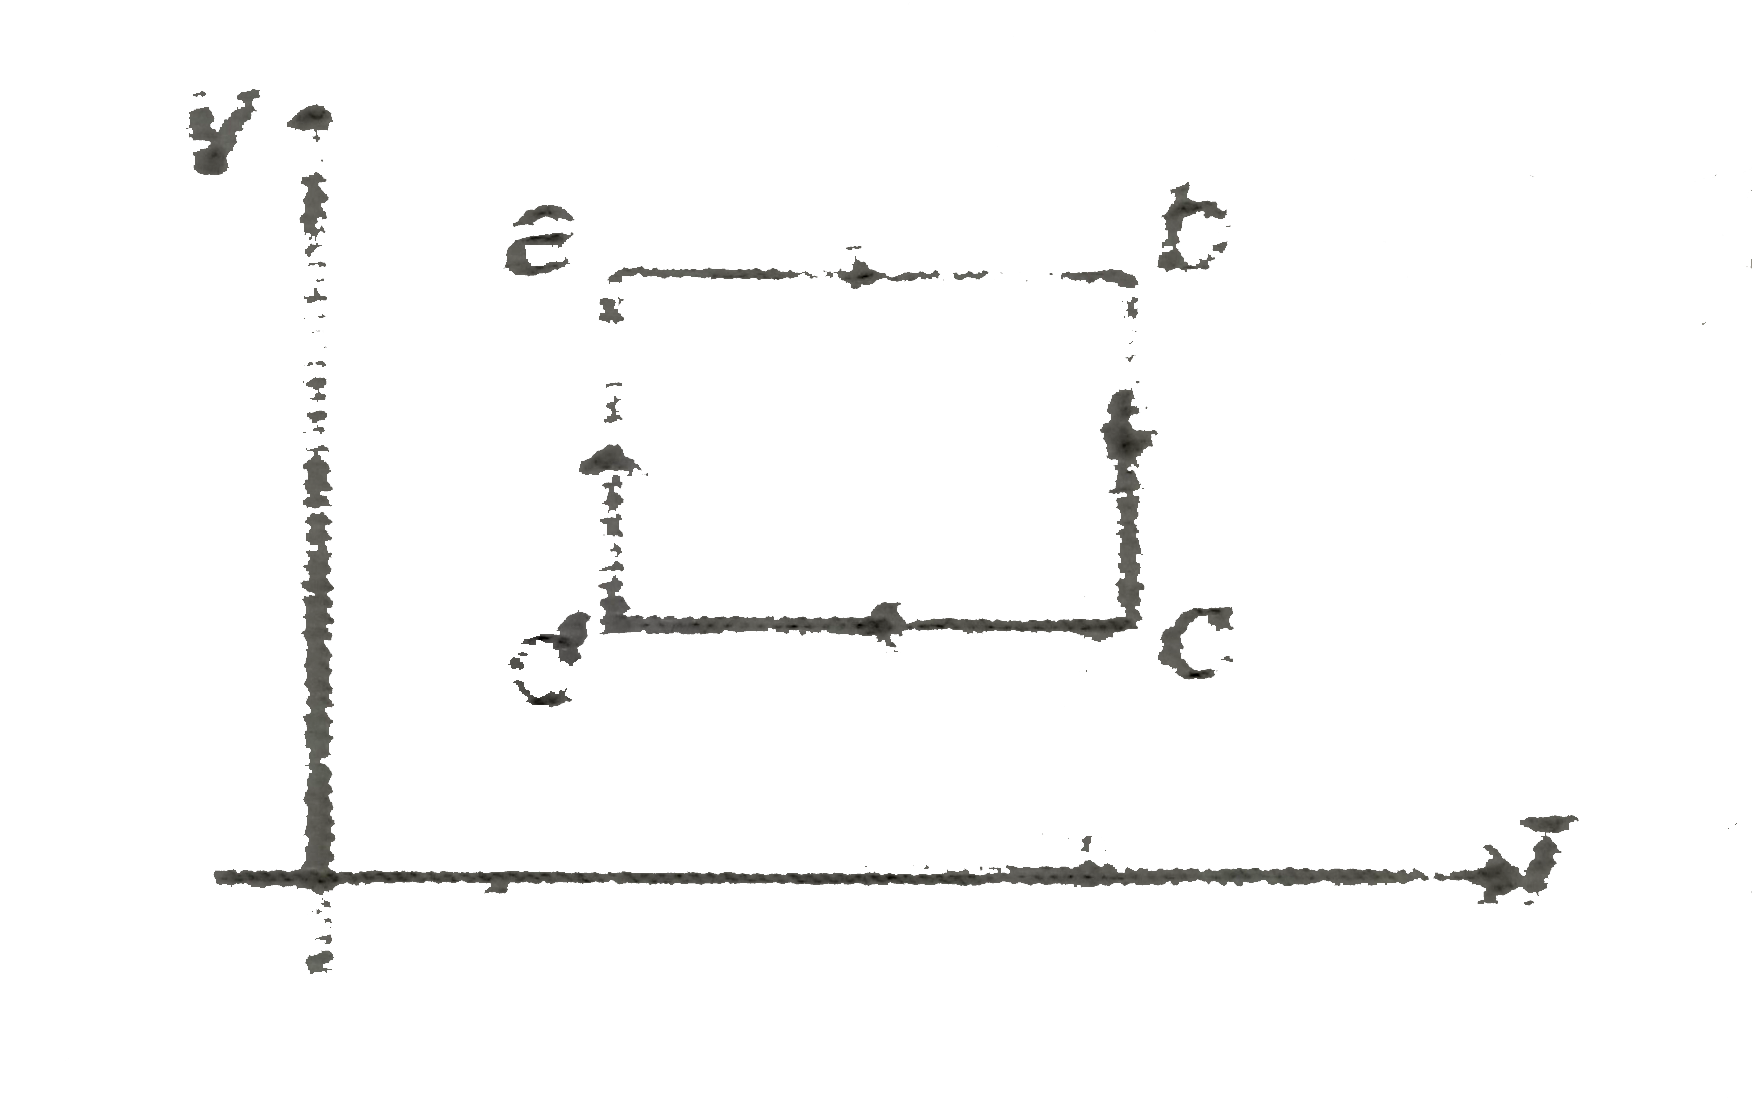
Heat is supplied to the gas in process (s).
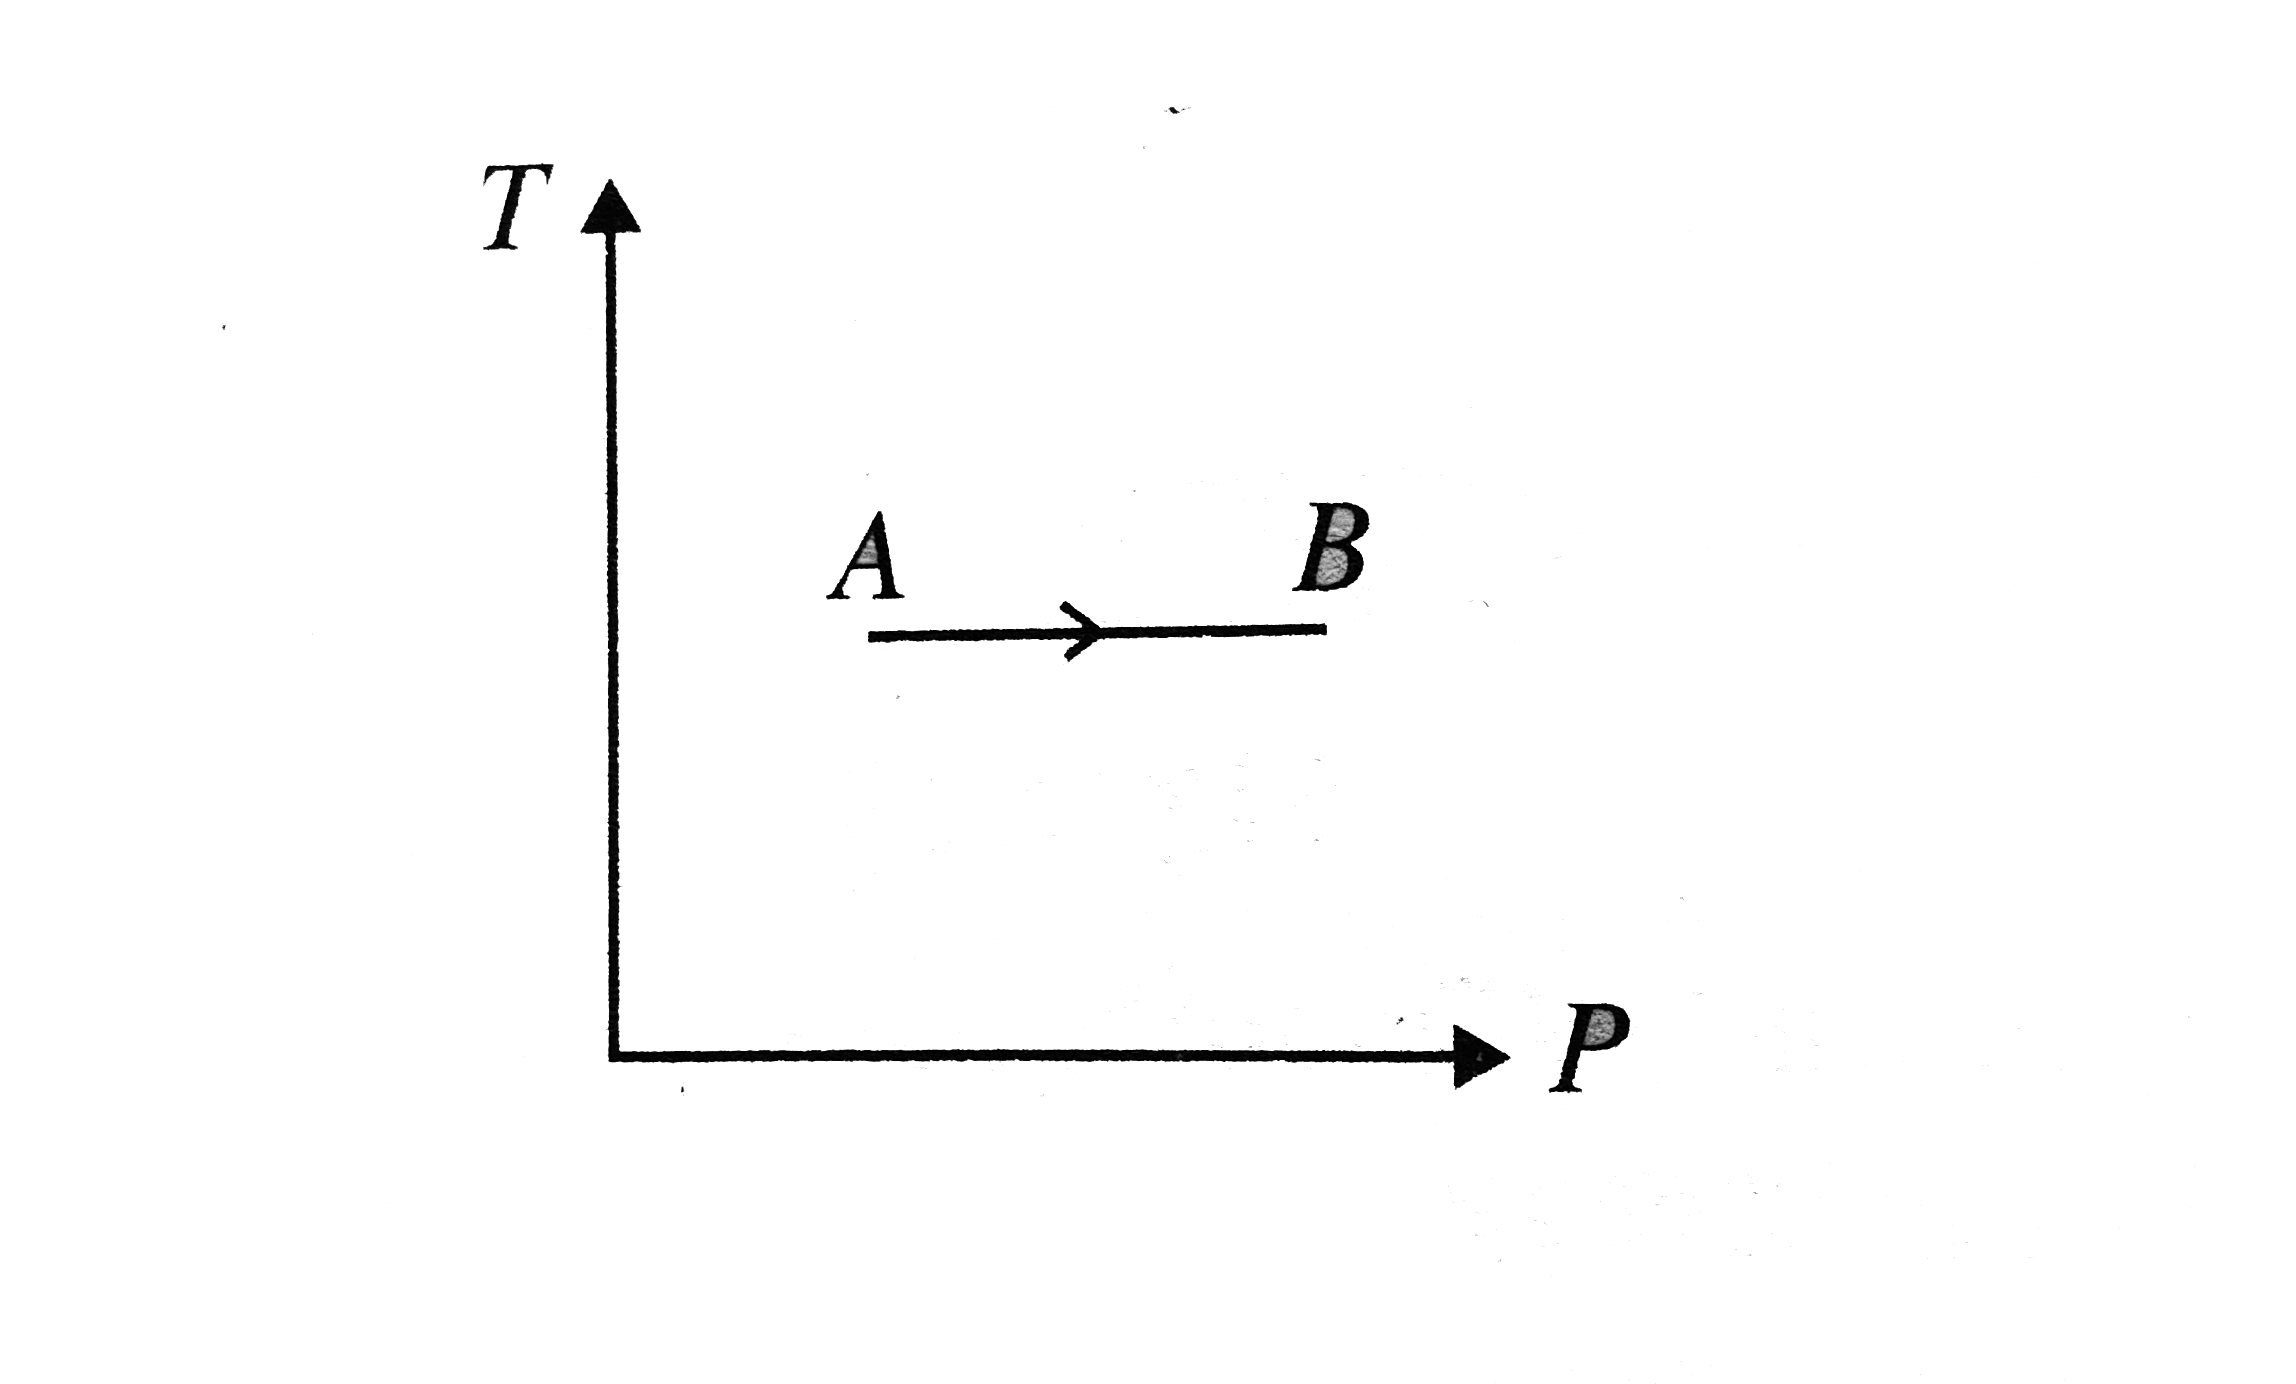
View SolutionTemperature versus pressure graph of an ideal gas is shown in Fig. During the process AB
View SolutionPressure versus temperature graph of an ideal gas as shown in Fig.
Corresponding density (ρ) versus volume (V) graph will be
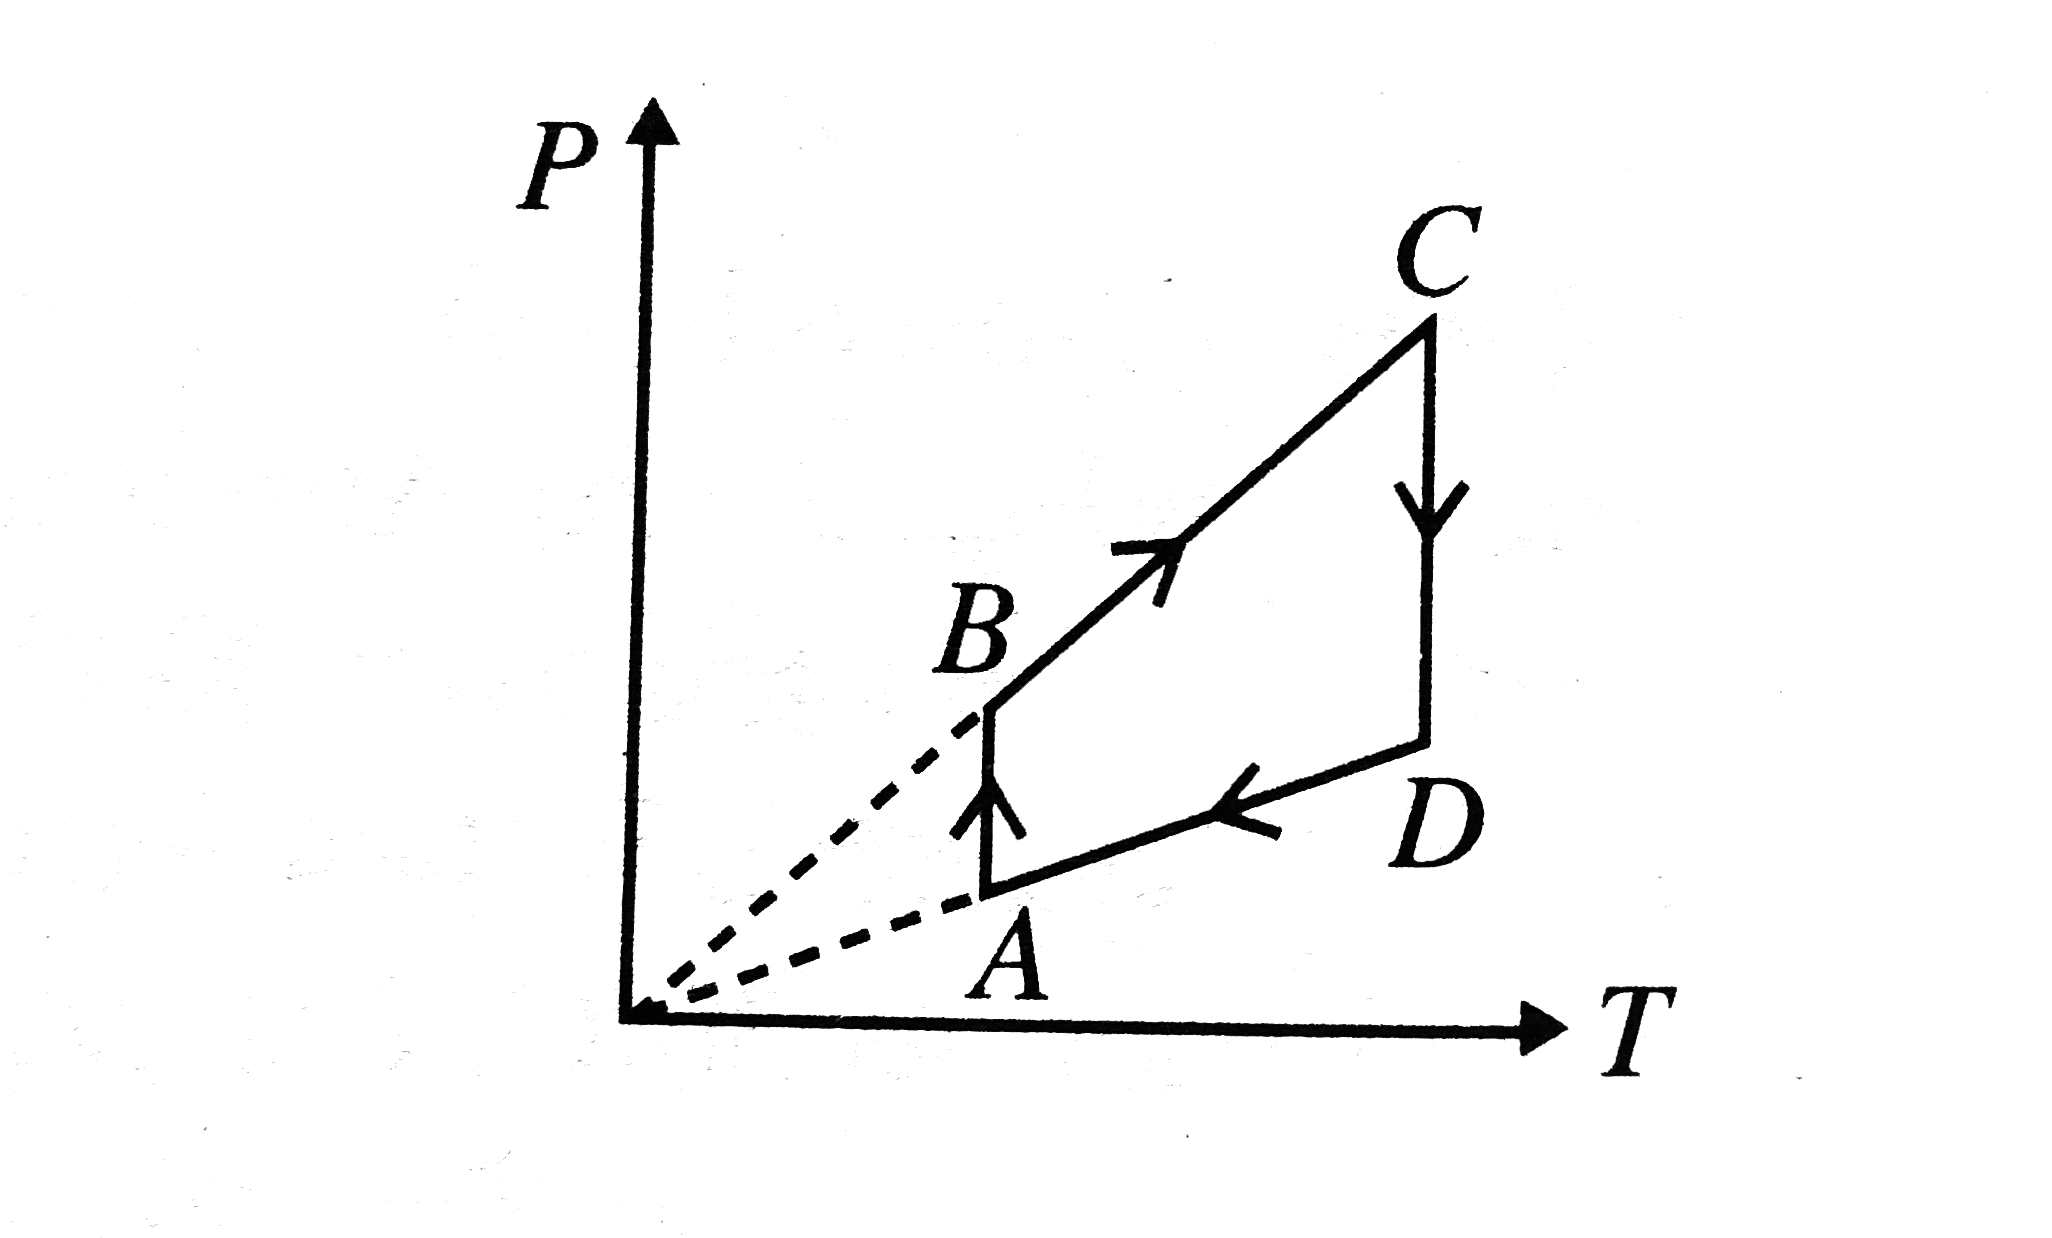
View SolutionPressure versus temperature graph of an ideal gas as shown in Fig.
Corresponding density (ρ) versus volume (V) graph will be

View Solutiongraph of an ideal gas is as shown in figure.
Work done by the gas in complete cyclic process about is
View Solution
