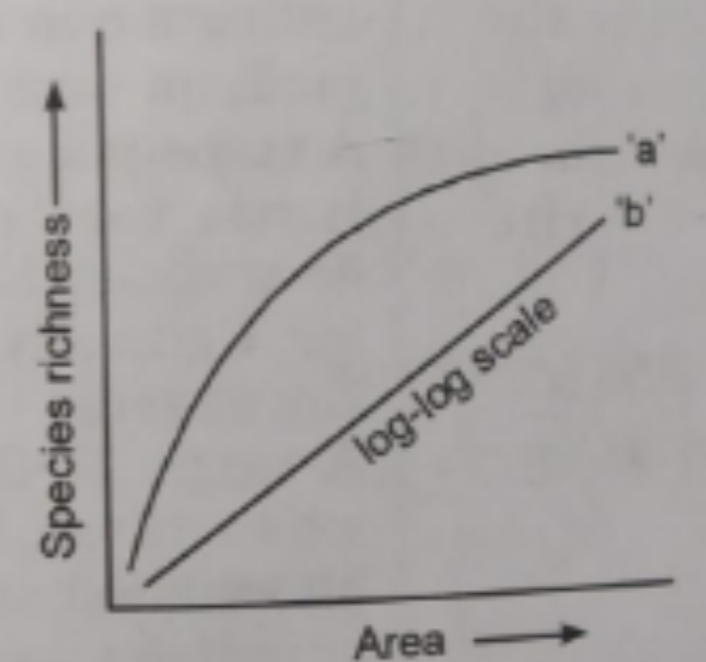
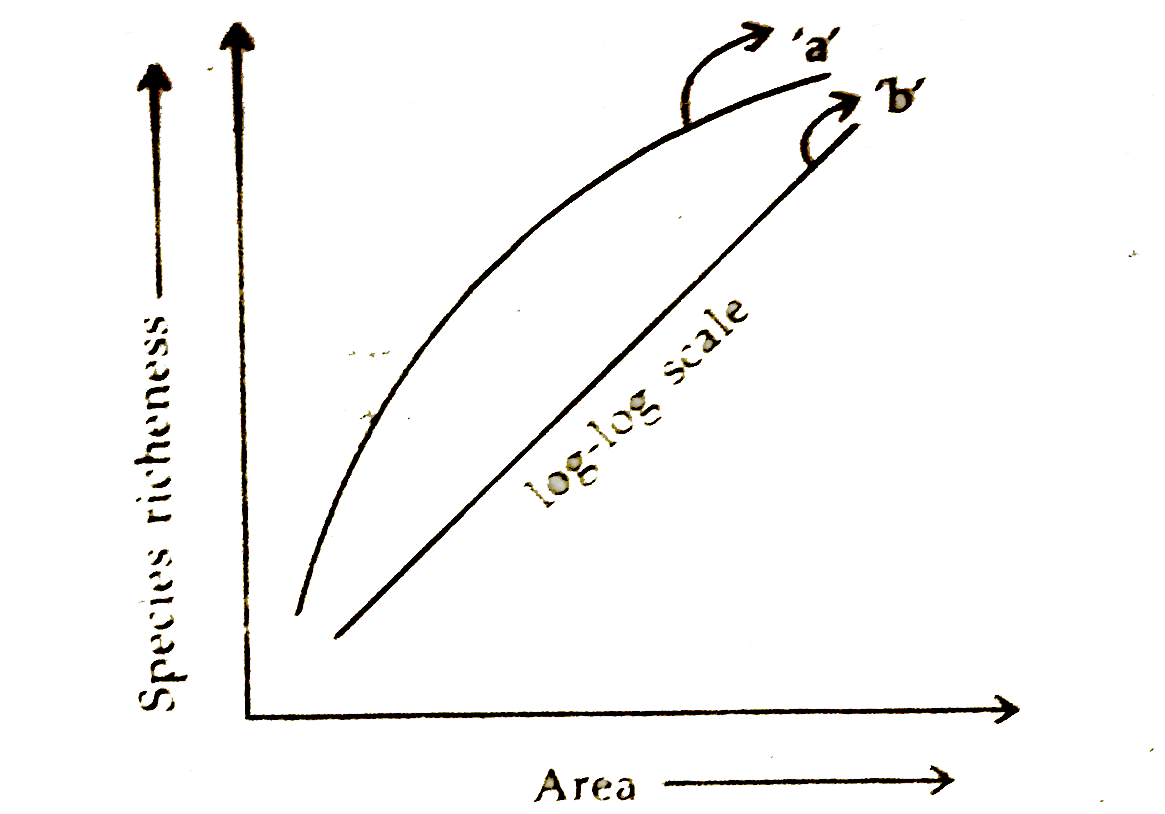
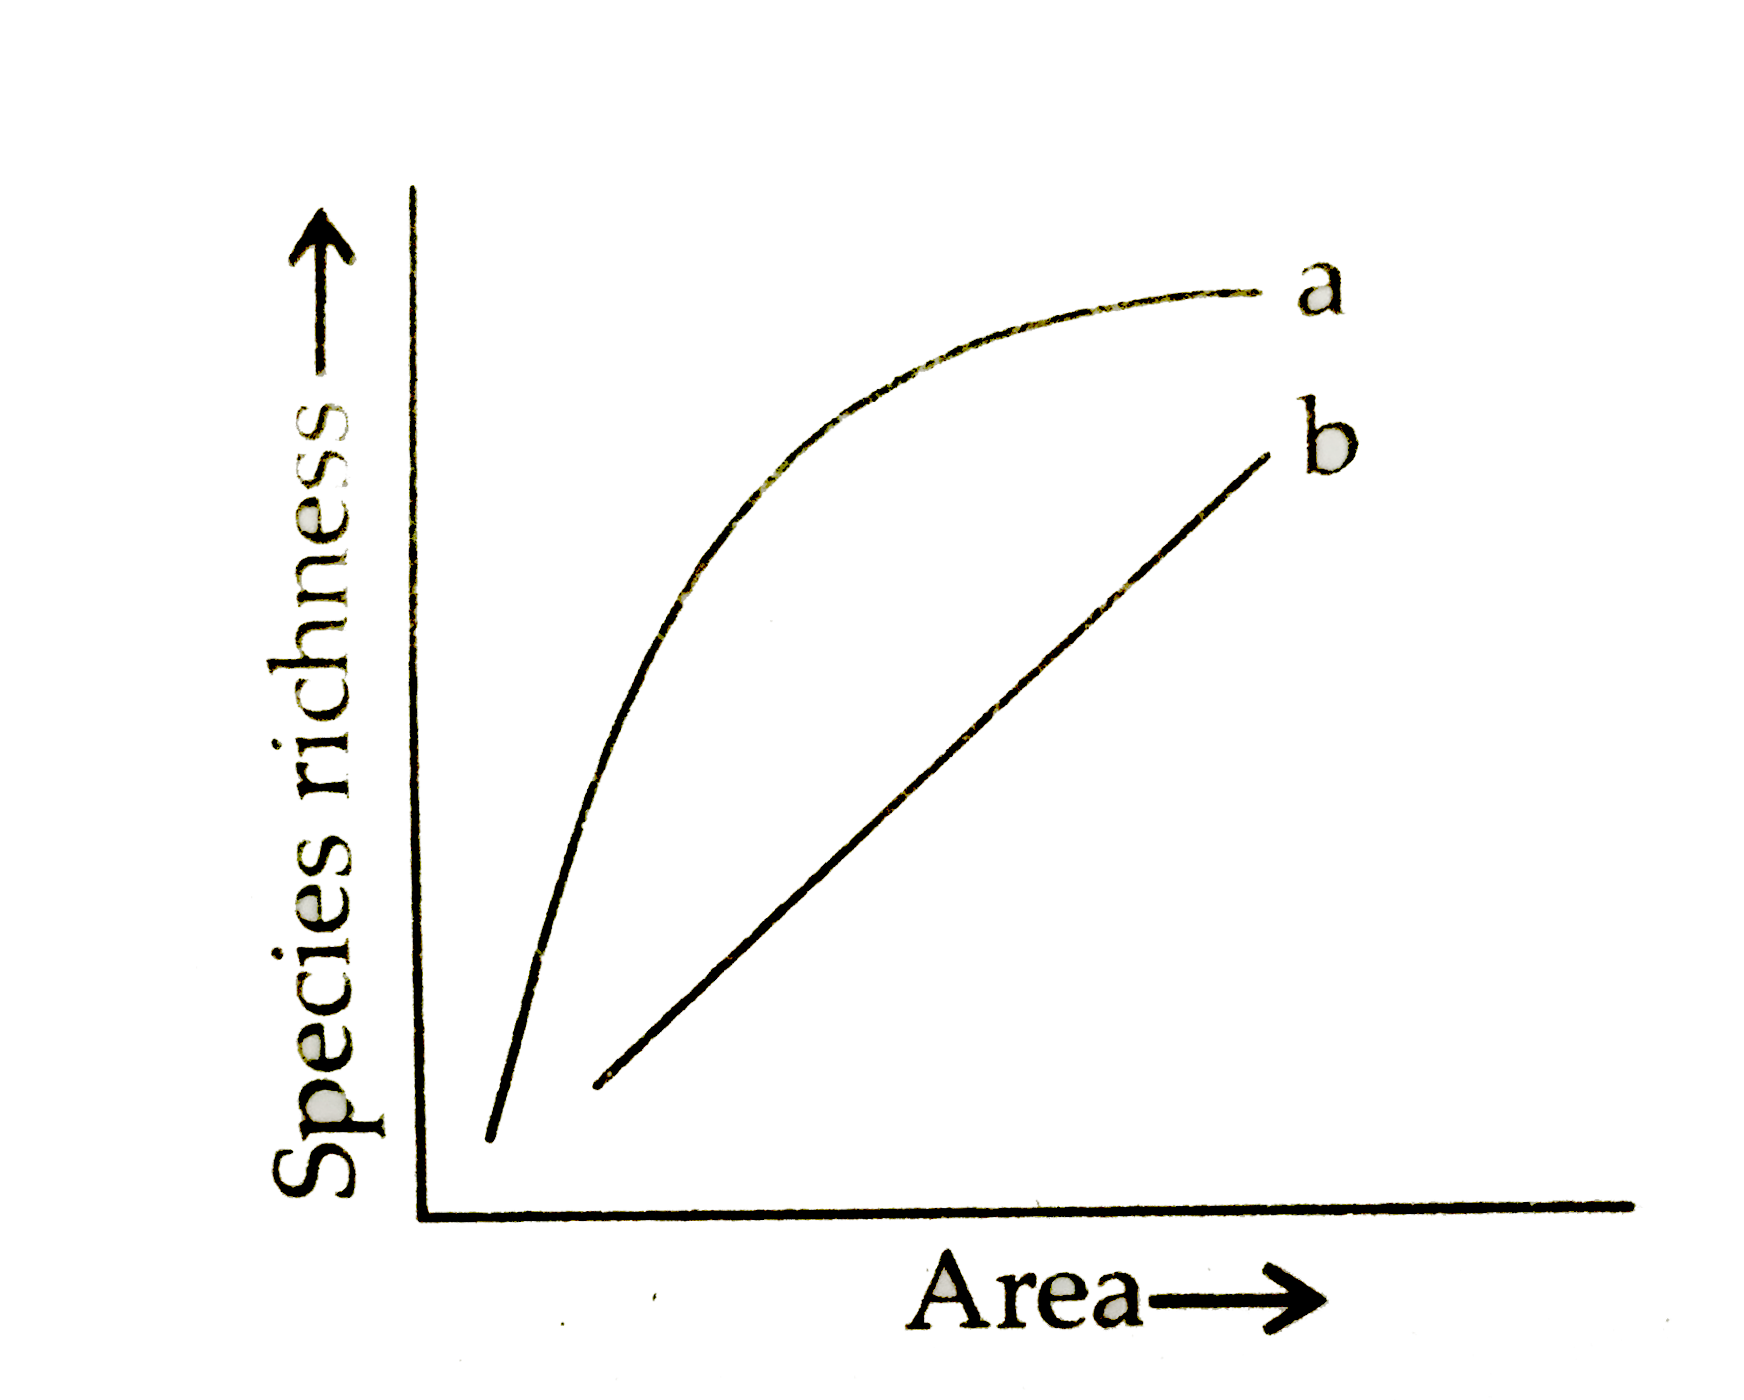
The following graph shows the species area relationship. Answer the following questions as directed.
When would the slpe of the line 'b' become steeper?
 Solution in Punjabi
If species between is more .
Topper's Solved these Questions
- BIODIVERSITY AND CONSERVATIONBOOK - BETTER CHOICE PUBLICATIONCHAPTER - BIODIVERSITY AND CONSERVATIONEXERCISE - LONG ANSWER TYPE QUESTIONS (5 MARKS)
13 Videos
- BIODIVERSITY AND CONSERVATIONBOOK - BETTER CHOICE PUBLICATIONCHAPTER - BIODIVERSITY AND CONSERVATIONEXERCISE - LONG ANSWER TYPE QUESTIONS (MOST EXPECTED QUESTIONS 5 MARKS)
9 Videos
- BIODIVERSITY AND CONSERVATIONBOOK - BETTER CHOICE PUBLICATIONCHAPTER - BIODIVERSITY AND CONSERVATIONEXERCISE - SHORT ANSWER TYPE QUESTIONS (3 MARKS)
13 Videos
- BIOTECHNOLOGY AND ITS APPLICATIONSBOOK - BETTER CHOICE PUBLICATIONCHAPTER - BIOTECHNOLOGY AND ITS APPLICATIONSEXERCISE - LONG ANSWER TYPE QUESTIONS
18 Videos
Similar Questions
What kinds of threats to the biodiversity may lead to its loss?
View SolutionBroadly classify the extinction processes.
View SolutionGive the main causes of extinction of a species by human intervention.
View SolutionExplain the role of biotechnology in therapeutics.
View SolutionA species area curve is drawn by plotting the number of species against the area. How is it that when a very large area is considered the slope is steeper than that for smaller areas ?
View SolutionThe following graph shows the species area relationship. Answers the Questions as directed. (a) Name the naturalist who studied the kind of relationship shown in the graph. Write the observations made by him. (b) Write the situations as discovered by the ecologists when the value of 'Z' (slope of the line) lies between (i) 0.1 and 0.2, (ii) 0.6 and 1.2 What does 'Z' stand for ? (c ) When would the slope of the line 'b' become steeper ?
View SolutionThe given graph shows species-area relationship. Write the equation of the curve 'a' and explain.
View SolutionThe above graph show Species-Area relationship. Write the equation of the curve a and explain.
View SolutionIf we analyse the species-area relationships among very large areas like the entire continents, then slope of line becomes much steeper in the range of
View SolutionA species area curve is drawn by plotting the number of species against the area. How is it that when a very large area is considered the slope is steeper than that for smaller areas ?
View SolutionThe following graph shows the species area relationship. Answers the Questions as directed.
(a) Name the naturalist who studied the kind of relationship shown in the graph.
Write the observations made by him.
(b) Write the situations as discovered by the ecologists when the value of 'Z' (slope of the line) lies between
(i) 0.1 and 0.2, (ii) 0.6 and 1.2
What does 'Z' stand for ?
(c ) When would the slope of the line 'b' become steeper ?

View SolutionThe above graph show Species-Area relationship. Write the equation of the curve a and explain.

View SolutionA species-area curve is drawn by plotting the number of species against the area. How is it that when a very large area is considered the slope is steeper than that for smaller areas ?
View SolutionThe graph shows species area relationship. If b denotes the relationship on log scale. Describe a and b .
View SolutionThe graph shows species area relationship. If b denotes the relationship on log scale. How is slope represented?Give the normal range of slope.
View Solution
