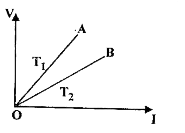
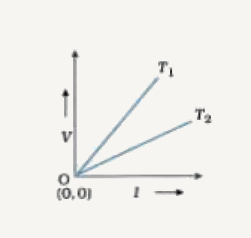
V-I graph for a mettalic wire at two different temperatures T1 and T2 is as shown in figure. WHich of the temperatures T1 and T2 is higher and why.
 Solution in Punjabi
At higher temperature, resistance of the metal wire will be more than at low temperature.
Slope of V.I. graph = Resistance of the metal wire
As V-I graph for metal wire at high temperature has more slope than that at low temperature.
So resistance of metal wire A is more than that of B.
Topper's Solved these Questions
- BOOK - BETTER CHOICE PUBLICATIONCHAPTER - ELECTRIC CURRENT, RESISTANCE AND E.M.F.EXERCISE - LONG ANSWERTYPE QUESTIONS8videos
ELECTRIC CURRENT, RESISTANCE AND E.M.F.
- BOOK - BETTER CHOICE PUBLICATIONCHAPTER - ELECTRIC CURRENT, RESISTANCE AND E.M.F.EXERCISE - NUMERICAL PROBLEMS54videos
ELECTRIC CURRENT, RESISTANCE AND E.M.F.
- BOOK - BETTER CHOICE PUBLICATIONCHAPTER - ELECTRIC CURRENT, RESISTANCE AND E.M.F.EXERCISE - MOST EXPECTED QUESTIONS14videos
ELECTRIC CURRENT, RESISTANCE AND E.M.F.
- BOOK - BETTER CHOICE PUBLICATIONCHAPTER - ELECTRIC CHARGES AND ELECTROSTATIC FORCE EXERCISE - NUMERICAL PROBLEMS (MOST EXPECTED NUMERICALS )6videos
ELECTRIC CHARGES AND ELECTROSTATIC FORCE
- BOOK - BETTER CHOICE PUBLICATIONCHAPTER - ELECTRIC FIELDEXERCISE - NUMERICAL PROBLEMS (MOST EXPECTED QUESTIONS)4videos
ELECTRIC FIELD
Similar Questions
Why are resistance connected in series ?
04:24View SolutionA battery of emf 10 V and internal resistance 2Ω is connected to parallel combination of two identical resistors of resistance R. Current in the circuit is 0.5 A. What is the resistance of each resistor ? Find the terminal voltage of the battery.
02:37View SolutionDefine SI unit of resistance.
04:51View SolutionDielectric constant of water is 80. What is its permittivity ?
05:46View SolutionA charged plastic spherical ball of mass 8.4×10⁻¹⁴kg is found to remain suspended in a uniform electric field of Entensity 5×10²NC−1. Calculate the charge on the ball.
View SolutionThe current - voltage graphs for a given metallic wire at two different temperatures T1andT2 are shown in the figure.
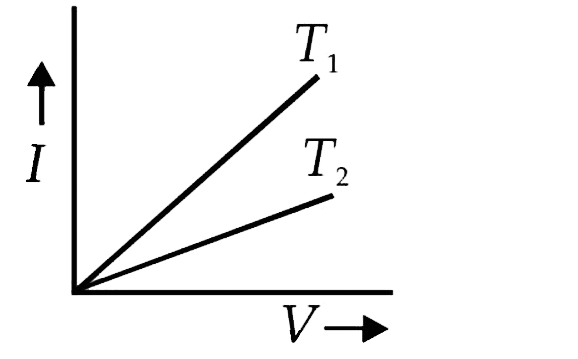
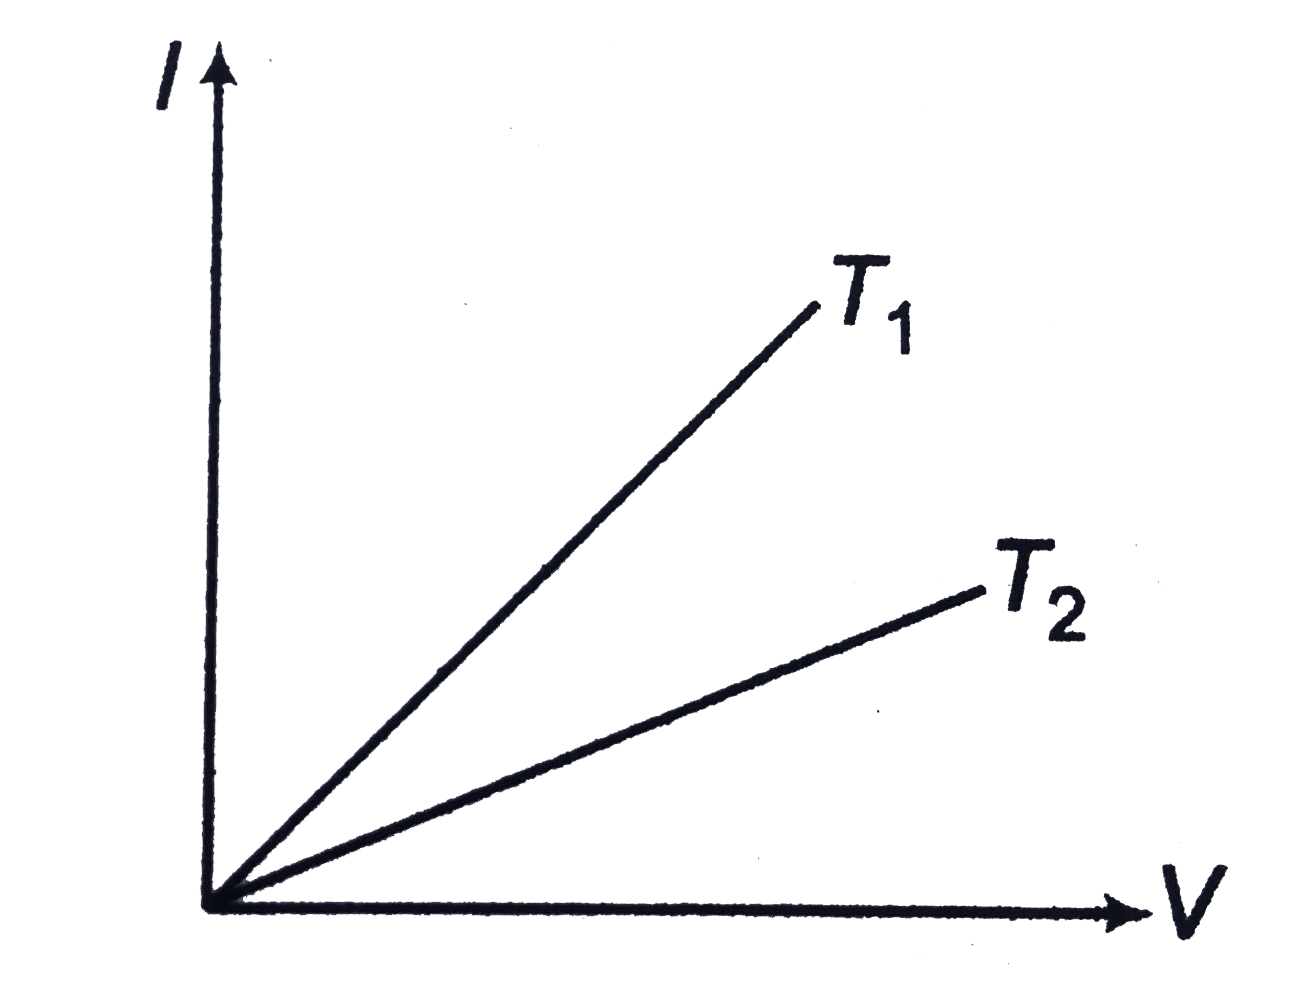
The temperature T2 is greater than T1.02:15View SolutionThe current voltage graphs for a given metalic wire two different temperature T1 and T2 are shown in figure The temperature T2 is greater than T1. Is this statement true or false?
 01:19View Solution
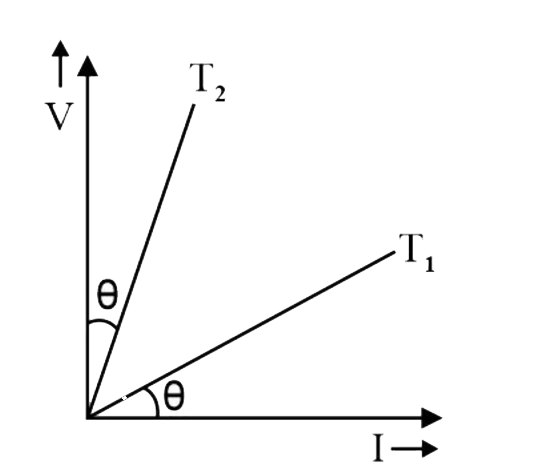
The V-i graph for a conductor at temeratures T_1 and T_2 are as shown in the figure. (T_2 - T_1) is alphaortional to. .
01:59View SolutionThe V - I graphs for a conductor at temperature T1andT2 are shown in the figure (T2−T1) is proportional to
 04:33View Solution
I-V graph for a given metallic wire at two temperatures T_1 and T_2 is as shown in Fig. Which of the two temperatures is lower and why?
06:07View SolutionV-I graph for a mettalic wire at two different temperatures T1 and T2 is as shown in figure. WHich of the temperatures T1 and T2 is higher and why.
 03:20View Solution
The voltage - current (V-1) graphs for a metallic conductor at two different temperatures T1andT2 are shown below:
At which temperature is the resistance higher?03:02View Solutionp - V diagram of same mass of a gas are drawn at two different temperatures (T_1) and (T_2) . Explain whether T_1 gt T_2 or T_2 gt T_1 . .
01:29View SolutionThe current voltage graphs for a given metalic wire two different temperature T1 and T2 are shown in figure The temperature T2 is greater than T1. Is this statement true or false?
 05:14View Solution
The VI graphs for a conductor at temperature T1 and T2 are shown in the figure
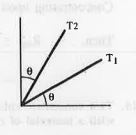 . Here (T2−T1) is proportional to02:15View Solution
