विभिन्न वर्षों में जनवितरण प्रणाली के अन्तर्गत खाद्यान्न का वितरण लाख टन में तथा उसमें से ग्रामीण तथा शहरी क्षेत्रों में उसके वितरण का प्रतिशत।
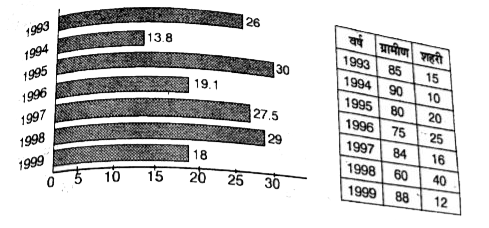
वर्ष 1995 की तुलना में वर्ष 1999 में वितरण में कितने प्रतिशत की कमी आयी ?
40%
25%
30%
60%
The correct Answer is:A
Step by step video, text & image solution for विभिन्न वर्षों में जनवितरण प्रणाली के अन्तर्गत खाद्यान्न का वितरण लाख टन में तथा उसमें से ग्रामीण तथा शहरी क्षेत्रों में उसके वितरण का प्रतिशत। वर्ष 1995 की तुलना में वर्ष 1999 में वितरण में कितने प्रतिशत की कमी आयी ? by Maths experts to help you in doubts & scoring excellent marks in Class 14 exams.
Updated on:21/07/2023Topper's Solved these Questions
- ग्राफBOOK - MAHESH MISHRACHAPTER - ग्राफEXERCISE - 29 B प्रतियोगी परीक्षाओं में पूछे गए प्रश्न
74 Videos
- क्रमचय और संचयBOOK - MAHESH MISHRACHAPTER - क्रमचय और संचयEXERCISE - 26 C (प्रतियोगी परीक्षाओं हेतु अभ्यास प्रश्नमाला)
35 Videos
- घातांक एंव करणीBOOK - MAHESH MISHRACHAPTER - घातांक एंव करणीEXERCISE - 4 C (प्रतियोगी परीक्षाओं हेतु अभ्यास प्रश्नमाला)
90 Videos
Similar Questions
दो कम्पनियोंA और B का विभिन्न वर्षों में शुद्ध लाभ का प्रतिशत
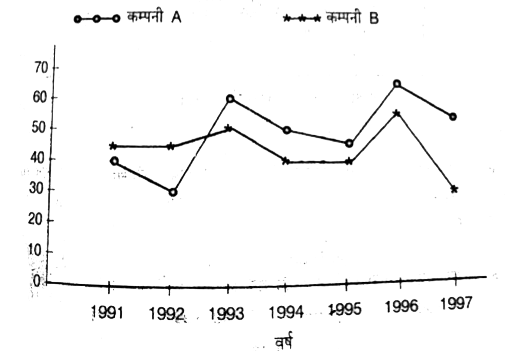
यदि 1992 में कम्पनी B की कुल आय 140 करोड़ रुपये थी, तब उस वर्ष उसका कुल खर्च (करोड़ रुपये में) क्या था ?
View Solution8 छात्र गणित विषय के, 7 छात्र विज्ञान के तथा 4 छात्र अंग्रेजी विषय के है। कितने तरीके से इन छात्रों को स्कॉलरशिप दिए जा सकते हैं यदि यह सर्वोच्च स्थान प्राप्त करनेवालों को ही दिया जाता है ?
View Solution81√0.04=?
View Solutionश्यानता | पोइस्यूइल का समीकरण | श्यान द्रव में वेग वितरण
View Solutionविभिन्न आवेश वितरण के कारण विद्युत क्षेत्र तीव्रता - आवेश का वितरण|बिंदु आवेश|रेखिया आवेश|वलय के केन्द्रो अवाम अक्ष पर|विद्युत् क्षेत्र में आवेशित कण|OMR
View SolutionThe table shows the number of cars sold by three showrooms over a period of six years. यह तालिका तीन शोरूम द्वारा छः वर्षों की अवधि में बेची गयी कारों की संख्या दर्शाती है | By what percent did the total number of cars sold by all three showrooms decrease during the year 2016, as compared to that in the year 2015 (nearest to one decimal place)? वर्ष 2015 की तुलना में वर्ष 2016 में तीनों शोरूम के द्वारा बेची गयी कारों की कुल संख्या में कितने प्रतिशत की कमी आयी है ? (एक दशमलव स्थान के निकटतम )
View SolutionThe given Bar Graph presents the number of students of two schools for six years. दिया गया दंड आरेख छः वर्ष की अवधि में दो विद्यालयों में छात्रों की संख्या को दर्शाता है | In which year, the percentage increase in students in school B is the highest in comparison to its previous year? किस वर्ष में, विद्यालय B में छात्रों की संख्या में प्रतिशत वृद्धि इसके पिछले वर्ष की तुलना में सबसे अधिक रही है?
View SolutionThe given Bar Graph presents the number of students of two schools for six years. दिया गया दंड आरेख छः वर्ष की अवधि में दो विद्यालयों में छात्रों की संख्या को दर्शाता है | In which year, the percentage increase of students in school A is the highest in comparison to its previous year? किस वर्ष, विद्यालय A में छात्रों की संख्या में प्रतिशत वृद्धि पिछले वर्ष की तुलना में सर्वाधिक है ?
View SolutionIn the given bar graph, the percentage decrease in the number of students in Institute A in 2016 is what percent of students in 2015. इस दंड आरेख में संस्थान A में 2016 में छात्रों की संख्या में प्रतिशत कमी 2015 के छात्रों की संख्या का क्या प्रतिशत है ?
View SolutionIn the following table, the production of various crops (in tonnes) is given from 2015 to 2019. Study the table and answer the question that follows:
दी गयी तालिका में, 2015 से 2019 तक विभिन्न फसलों का उत्पादन (टन में ) दिया गया है | इस तालिका का अध्ययन करें तथा फिर पूछे गए प्रश्न का उत्तर दीजिए |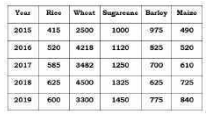 The percentage growth of maize in the year 2019 over the year 2015 is: (correct to one decimal place)
वर्ष 2019 में वर्ष 2015 की तुलना में मक्का के उत्पादन में कितने प्रतिशत की वृद्धि हुई है ? ( दशमलव के एक स्थान तक )
View SolutionThe following graph shows the sales of cars (in thousands) in four cities in 4 years. Study the graph and answer the questions.
निम्नलिखित आरेख 4 वर्षों में चार शहरों में कारों की बिक्री (हज़ार में) को दर्शाता है। इस आरेख का अध्ययन कीजिए तथा प्रश्नों के उत्तर दीजिए। Which city has the highest percentage of sales, and in which year?
किस शहर की बिक्री का प्रतिशत सबसे अधिक है तथा किस वर्ष में?
View SolutionStudy the given chart carefully and answer the question accordingly:
दिए गए चार्ट का ध्यानपूर्वक अध्ययन करें और उसके अनुसार प्रश्न का उत्तर दें: In which of the following years was the percentage increase in production from the previous year, the maximum among the given years?
पिछले वर्ष की तुलना में निम्नलिखित वर्षों में से किस वर्ष में उत्पादन में अधिकतम प्रतिशत वृद्धि हुई?
View SolutionStudy the chart and answer the questions:
In which of the given years is the percentage increase in the number of hotels in comparison to the previous year, is the maximum?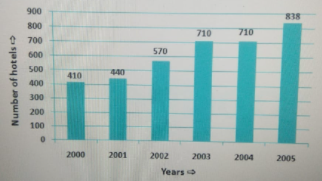
चार्ट का अध्ययन करें और प्रश्नों का उत्तर दें:पिछले वर्ष की तुलना में होटलों की संख्या में किस वर्ष में अधिकतम प्रतिशत वृद्धि हुई है?
View SolutionStudy the pie chart and answer the question that follows
आरेख का अध्ययन करें और प्रश्न का उत्तर दे।
Break up (degree wise) of students in terms of specialization in different areas (A,B,C,D&E) in MBA program.
MBA कार्यक्रम में विभिन्न क्षेत्रों (A, B, C, D और E) में विशेषज्ञता के संदर्भ में छात्रों का वितरण
The number of students specialising in E is what percent more than that of students specialising in C?
E में विशेषज्ञता प्राप्त छात्रों की संख्या, C में विशेषज्ञता प्राप्त छात्रों की संख्या की तुलना में कितना प्रतिशत अधिक है?
View SolutionWhat was the approximate decline in the prodcution of flavour R in 2010 as compared to the production of 2008 in percentage?
वर्ष 2008 की तुलना में वर्ष 2010 में गन्ध R के उत्पादन में कितने प्रतिशत की कमी आई थी?
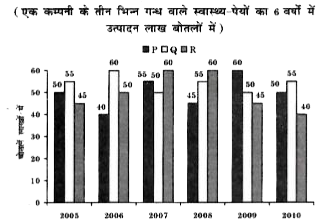
View SolutionThe percentage of the total production of flavour R in 2007 and 2008 with respect to the production of flavour P in 2005 and 2006 is : वर्ष 2007 तथा 2008 में गन्ध R का कुल उत्पादन, वर्ष 2005 तथा 2006 में गन्ध P के उत्पादन की तुलना में कितने प्रतिशत रहा है?
View Solution
