निम्नलिखित ग्राफ ब्रांड तथा संग्रहीत कम्प्यूटर की बिक्री में प्रतिशत वृद्धि को दिखाता है ।
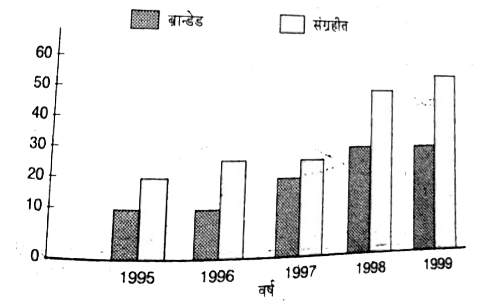
किस वर्ष पिछले वर्ष की तुलना में संग्रहीत कम्प्यूटर की बिक्री में प्रतिशत वृद्धि सर्वाधिक है?
1995
1996
1998
1997
The correct Answer is:1998 में पिछले वर्ष की तुलना में वृद्धि का प्रतिशत अधिकतम है।
Step by step video, text & image solution for निम्नलिखित ग्राफ ब्रांड तथा संग्रहीत कम्प्यूटर की बिक्री में प्रतिशत वृद्धि को दिखाता है । किस वर्ष पिछले वर्ष की तुलना में संग्रहीत कम्प्यूटर की बिक्री में प्रतिशत वृद्धि सर्वाधिक है? by Maths experts to help you in doubts & scoring excellent marks in Class 14 exams.
Updated on:21/07/2023Topper's Solved these Questions
- ग्राफBOOK - MAHESH MISHRACHAPTER - ग्राफEXERCISE - 29 B प्रतियोगी परीक्षाओं में पूछे गए प्रश्न
74 Videos
- ग्राफBOOK - MAHESH MISHRACHAPTER - ग्राफEXERCISE - 29 C प्रतियोगी परीक्षाओं हेतु अभ्यास प्रश्नमाला
71 Videos
- क्रमचय और संचयBOOK - MAHESH MISHRACHAPTER - क्रमचय और संचयEXERCISE - 26 C (प्रतियोगी परीक्षाओं हेतु अभ्यास प्रश्नमाला)
35 Videos
- घातांक एंव करणीBOOK - MAHESH MISHRACHAPTER - घातांक एंव करणीEXERCISE - 4 C (प्रतियोगी परीक्षाओं हेतु अभ्यास प्रश्नमाला)
90 Videos
Similar Questions
दो कम्पनियोंA और B का विभिन्न वर्षों में शुद्ध लाभ का प्रतिशत
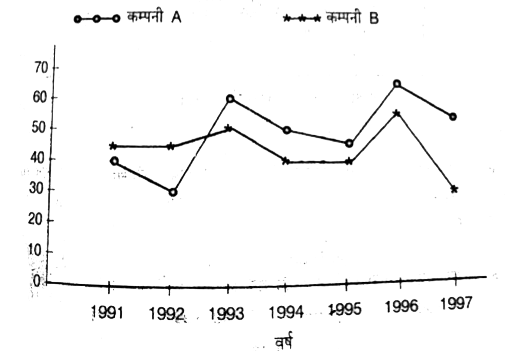
यदि 1992 में कम्पनी B की कुल आय 140 करोड़ रुपये थी, तब उस वर्ष उसका कुल खर्च (करोड़ रुपये में) क्या था ?
View Solutionविभिन्न वर्षों में बीमार औद्योगिक इकाईयों की संख्या (×1000) तथा बैंक का बकाया ऋण (×100) करोड़ रुपये में
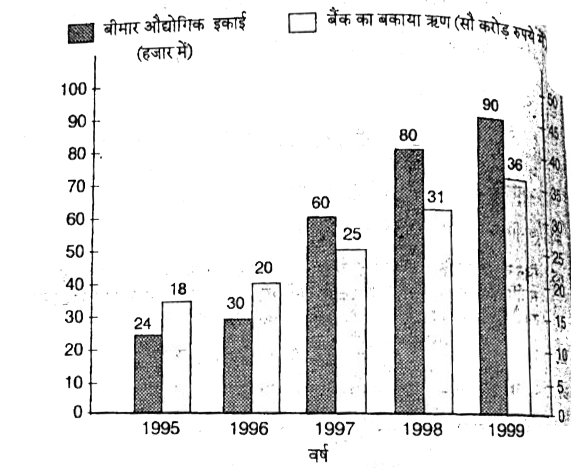
किस वर्ष बैंक का ऋण प्रति बीमार इकाई अधिकतम था ?
View Solution8 छात्र गणित विषय के, 7 छात्र विज्ञान के तथा 4 छात्र अंग्रेजी विषय के है। कितने तरीके से इन छात्रों को स्कॉलरशिप दिए जा सकते हैं यदि यह सर्वोच्च स्थान प्राप्त करनेवालों को ही दिया जाता है ?
View Solution81√0.04=?
View SolutionMatch the following Column A to Column B

View SolutionThe table below shows the sales of milk in six different states as a percentage of total sales. In each state only two milkmen A and B sell the milk. The table below shows the sales of salesman A as percentage of total sale of milk in each state. The total sales of milk is 200000 litres.
नीचे दी गईं तालिका में छः विभिन्न राज्यों में दूध की कुल बिक्री को प्रतिशत में दर्शाया गया है। प्रत्येक राज्य में केवल दो दूध विक्रेता A तथा B दूध बेचते है। नीचे दी गई तालिका प्रत्येक राज्य में दूध की कुल बिक्री के प्रतिशत में विक्रेता A दवारा की गई बिक्री को दर्शाती है। दूध की कुल बिक्री 200000 लीटर है।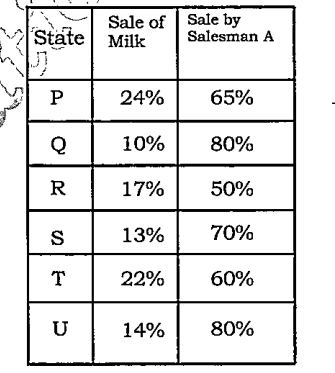 What is the respective ratio of
sales of milk in state P and Q by salesmen B and the sales of milk in state R and T by salesmen A?
राज्य P तथा Q में विक्रेता B द्वारा की गई दूध की बिक्री तथा राज्य R तथा T में विक्रेता A द्वारा की गई दूध की बिक्री का क्रमशः अनुपात क्या है?
View SolutionThe table below shows the sales of milk in six different states as a percentage of total sales. In each state only two milkmen A and B sell the milk. The table below shows the sales of salesman A as percentage of total sale of milk in each state. The total sales of milk is 200000 litres.
नीचे दी गईं तालिका में छः विभिन्न राज्यों में दूध की कुल बिक्री को प्रतिशत में दर्शाया गया है। प्रत्येक राज्य में केवल दो दूध विक्रेता A तथा B दूध बेचते है। नीचे दी गई तालिका प्रत्येक राज्य में दूध की कुल बिक्री के प्रतिशत में विक्रेता A दवारा की गई बिक्री को दर्शाती है। दूध की कुल बिक्री 200000 लीटर है।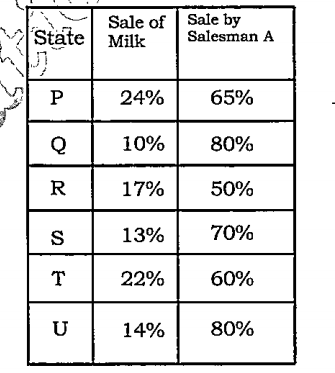 What will be difference (in litres) in the sale of milk in state T by
salesmen B and the total sale of milk in state R and S together?
राज्य T में विक्रेता B द्वारा की गई दूध की बिक्री तथा राज्य R तथा S में मिलाकर हुई दूध की कूल बिक्री में क्या अंतर (लीटर में) है?
View SolutionThe following line diagram represents the yearly sales figure of a company in the years 2001-2010. Examine the diagram and answer the question. निम्नलिखित रेखा आरेख किसी कंपनी की वर्ष 2007-2010 के दौरान वार्षिक बिक्री के आंकड़ों को दर्शाता है। आरेख का अध्ययन करें और नीचे दिए गए प्रश्नों के उत्तर दें- By what percent did the sales in 2008 decrease in comparison to the sales in 2006? वर्ष 2006 में बिक्री की तुलना में वर्ष 2008 में बिक्रो में कितने प्रतिशत की कमी आई?
View SolutionThe following line diagram represents the yearly sales figure of a company in the years 2001-2010. Examine the diagram and answer the question. निम्नलिखित रेखा आरेख किसी कंपनी की वर्ष 2007-2010 के दौरान वार्षिक बिक्री के आंकड़ों को दर्शाता है। आरेख का अध्ययन करें और नीचे दिए गए प्रश्नों के उत्तर दें- The percentage increase in sales in the year 2005 with respect to the previous year is वर्ष 2005 में पिछले वर्ष की तुलना में बिक्री में वृद्धि का प्रतिशत है-
View Solutionप्रेमचंद की सभी कहानियाँ किस पुस्तक में संग्रहीत है ?
View SolutionThe given Bar Graph presents the results in terms of number of students for the five academic years, 2013-2014 to 2017-2018. दिया गया दंड आरेख पांच शैक्षणिक वर्षों : 2013-2014 से 2017-2018 तक छात्रों की संख्या के संदर्भ में परिणामों को प्रस्तुत करता है | In which year the percentage increase in the total number of students is the highest in comparison to the previous academic year? किस वर्ष कुल छात्रों की संख्या में प्रतिशत वृद्धि पिछले शैक्षणिक वर्ष की तुलना में सर्वाधिक है ?
View SolutionThe given Bar Graph presents the number of students of two schools for six years. दिया गया दंड आरेख छः वर्ष की अवधि में दो विद्यालयों में छात्रों की संख्या को दर्शाता है | In which year, the percentage increase in students in school B is the highest in comparison to its previous year? किस वर्ष में, विद्यालय B में छात्रों की संख्या में प्रतिशत वृद्धि इसके पिछले वर्ष की तुलना में सबसे अधिक रही है?
View SolutionThe given Bar Graph presents the number of students of two schools for six years. दिया गया दंड आरेख छः वर्ष की अवधि में दो विद्यालयों में छात्रों की संख्या को दर्शाता है | In which year, the percentage increase of students in school A is the highest in comparison to its previous year? किस वर्ष, विद्यालय A में छात्रों की संख्या में प्रतिशत वृद्धि पिछले वर्ष की तुलना में सर्वाधिक है ?
View SolutionThe given Bar Graph presents the number of students of two schools for six years. दिया गया दंड आरेख छः वर्ष की अवधि में दो विद्यालयों में छात्रों की संख्या को दर्शाता है | In which year the percentage increase in the number of total students in schools A and B taken together is the highest in comparison to its previous year? किस वर्ष विद्यालय A और B को मिलाकर कुल छात्रों की संख्या में प्रतिशत वृद्धि पिछले वर्ष की तुलना में सर्वाधिक है ?
View SolutionThe given Bar Graph presents the results in terms of the number of students in a school for the five academic years, 2013-2014 to 2017-2018. In which year the percentage increase in total number of students is the lowest in comparison to its previous academic year? दिया गया दंड आरेख पांच शैक्षणिक वर्षों : 2013-2014 से 2017-2018 तक एक विद्यालय में छात्रों की संख्या के संदर्भ में परिणामों को प्रस्तुत करता है | किस वर्ष छात्रों की कुल संख्या में प्रतिशत वृद्धि पिछले शैक्षणिक वर्ष की तुलना में सबसे कम है ?
View SolutionThe given bar graph shows the sale of books (in thousands) in four metropolitan branches of a company for the year 2014 and 2015. दिया गया बार ग्राफ वर्ष 2014 और 2015 के लिए किसी कंपनी की चार महानगरीय शाखाओं में पुस्तकों की (हज़ारो में ) बिक्री को दर्शाता है | In the given bar graph, compared to 2014, which of the branch saw maximum increase in sales (in%) in 2015? दिए गए बार ग्राफ में, 2014 की तुलना में 2015में कौन सी शाखा की बिक्री में अधिकतम वृद्धि (% में ) हुई ?
View Solution
