नीचे दिए गए ग्राफ का अध्ययन कर और प्रश्न का उत्तर दे।
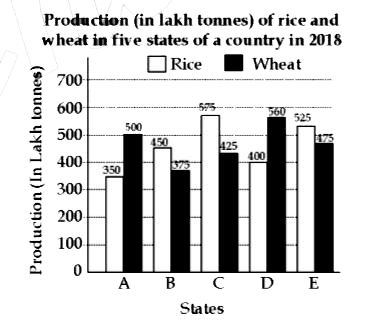
राज्यों C और E में चावल के कुल उत्पादन का, राज्यों B और D में गेहूं के कुल उत्पादन से अनुमान ……….है।
11:10
22:19
20:17
13:12
The correct Answer is:C
Step by step video, text & image solution for नीचे दिए गए ग्राफ का अध्ययन कर और प्रश्न का उत्तर दे। राज्यों C और E में चावल के कुल उत्पादन का, राज्यों B और D में गेहूं के कुल उत्पादन से अनुमान ……….है। by Maths experts to help you in doubts & scoring excellent marks in Class 14 exams.
Updated on:21/07/2023Topper's Solved these Questions
Similar Questions
यदि A:B=2:3 और B:C=3:7, तो A+B:B+C:C+A क्या होगा?
View SolutionP और Q की वर्तमान आयु के बीच का क्रमशः अनुपात 3 : 4 है। चार वर्ष बाद Q, P से पाँच वर्ष बड़ा होगा।P की वर्तमान आयु कितनी है?
View SolutionMatch the following Column A to Column B

View Solutionएक टी. वी बनाने के कारखाने में मशीने A,B और C कुल उत्पादन का क्रमशः 30 % और 50 % टी .वी बनाती है। इन मशीनो के उत्पादन का क्रमशः 7% , 5 % और 2% टी . वी खराब (त्रुटिपूर्ण ) पायी जाती है। टी .वी के कुल उत्पादन में से एक टी वी यदृच्छया जाँच के लिए निकाला गया है और वह खराब (त्रुटिपूर्ण ) पाया गया है। इसकी प्रायिकता ज्ञात कीजिए कि वह मशीन A द्वारा बनाया गया है।
View SolutionStudy the given graph and answer the question that follows.
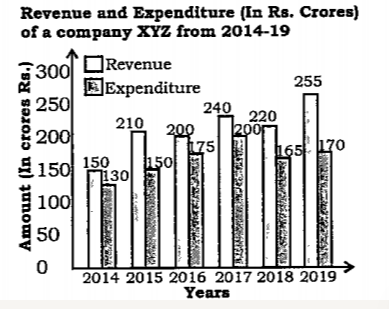
The total revenue in 2015 and 2017 is what per cent of the total expenditure of the company in 2016,2018 and 2019 ( correct to one decimal place)?
दिए गए ग्राफ का अध्ययन करें और नीचे दिए गए प्रश्न का उत्तर दें। 2015 और 2017 2 कुल आय (revenue), 2016, 2018 और 2019 में कंपनी के कुल व्यय (Expenditure) की कितनी प्रतिशत है (दशमलव के बाद एक
स्थान तक गणना करें?
View SolutionStudy the given graph and answer the question that follows. Production and Exports of Computers(In Thousands)by company XYZ in six years The total production of computers in 2013, 2015 and 2018 is x% of the total exports of computers by the company during the six years. The value of x is: दिए गए ग्राफ का अध्ययन करें और इस प्रश्न का उत्तर दें। 2013, 2015 और 2018 छह वर्षों के दौरान कंपनी द्वारा कंप्यूटरों के कुल निर्यात का x% है। X का मान है
View SolutionStudy the following bar graph and answer the question given. निम्नलिखित दंड-आरेख (बार-ग्राफ) का अध्ययन कीजिए तथा दिए गए प्रश्न का उत्तर दीजिए: The total production of motorcycles of companies C, D and E is what per cent less than the total demand of motorcycles of all the companies during five years? कंपनी C,D और E के द्वारा मोटरसाइकिलों का कुल उत्पादन, पांच वर्षों के दौरान सभी कंपनियों की मोटरसाइकिलों की कुल मांग से कितने ग्रतिशत कम है?
View SolutionStudy the following graph which shows the production (in thousand) of different items, and answer the questions. निम्नलिखित ग्राफ का अध्ययन कीजिए, जिन विभिन्न मदों का उत्पादन (हजार में) दर्शाया गया है तथा दिए गए प्रश्नों के उत्तर दीजिए। The total number of all products produced by the company in the year 2006 and 2008 together is:- कंपनी द्वारा वर्ष 2006 और 2008 में तेयार सभी उत्पादों को मिलाकर उनकी कुल संख्या कितनी है?
View SolutionThe pie-chart provided below gives the distribution of land (in a village) under various food crops. Study the pie-chart carefully and answer the questions. नीचे दिए गए वृत्तारेखा में विभिन खाद्य फसलों के ( एक गाँव में ) भूमि का वितरण दिखाया गया हैं। वृत्तारेखा का अध्ययन कीजिए और प्रश्नों के उत्तर दीजिए। The ratio of the land used for rice and barley is चावल और जौ के उत्पादन के लिए प्रयुक्त भूमि का अनुपात है-
View SolutionThe pie-chart provided below gives the distribution of land (in a village) under various food crops. Study the pie-chart carefully and answer the questions. नीचे दिए गए वृत्तारेखा में विभिन खाद्य फसलों के ( एक गाँव में ) भूमि का वितरण दिखाया गया हैं। वृत्तारेखा का अध्ययन कीजिए और प्रश्नों के उत्तर दीजिए। If the production of rice is 5 times that of jowar and the production of jowar is 2 times that of bazra, then the ratio between the yield per acre of rice and bazra is यदि चावल का उत्पादन ज्वार का पांच गुना और ज्वार का उत्पादन बाजरे का दो गुना हो, तब चावल और बाजरे के प्रति एकड़ उत्पादन का अनुपात है-
View SolutionThe table shows the production of different types of cars (in thousands). यह तालिका अलग-अलग प्रकार के कारों का उत्पादन ( हज़ार में) दर्शाती है | What is the ratio of the total production of cars of type A in 2014 and type C in 2013 taken together to the total production of cars of type B in 2016 and type E in 2015 taken together? 2014 में A प्रकार की कारों और 2013 में C प्रकार की कारों के कु ल उत्पादन का 2016 में B प्रकार की कारों और 2015 में E प्रकार की कारों के कुल उत्पादन के साथ अनुपात ज्ञात करें |
View SolutionStudy the following bar graph and answer the question given.
निम्नलिखित दंड आरेख का अध्ययन करें तथा दिए गए प्रश्न का उत्तर दें |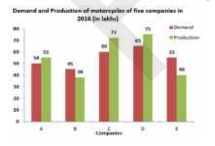 The ratio of the total demand of motorcycles of companies A, C and E to the total production of
motorcycles of B and C is:
कंपनी A, C और E की मोटरसाइकिल की कुल मांग और B तथा C की मोटरसाइकिल के कुल उत्पादन के बीच अनुपात ज्ञात करें
View SolutionThe table shows the production of different types of cars (in thousands)
यह तालिका अलग-अलग प्रकार के कारों का उत्पादन ( हज़ार में ) दर्शाती है |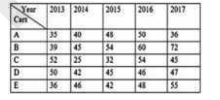 The ratio of the total production of cars of type C and E taken together in 2013 to the total production of cars of type D in 2014 and 2016 and type E in 2017 taken together is:
2013 में C और E प्रकार की कारों के कुल उत्पादन का 2014 और 2016 में D तथा 2017 में E प्रकार की कारों के कुल उत्पादन के साथ अनुपात ज्ञात करें |
View SolutionThe bar graph given below shows the target and actual production of cement ( in thousand tons ) during 2013-2017. The ratio of the target production in 2014 and 2016 to the actual total production in 2013, 2016 and 2017 is :
नीचे दिया गया दंड आरेख 2013-2017 के दौरान सीमेंट के लक्षित और वास्तविक उत्पादन (हजार टन में) को दर्शाता है |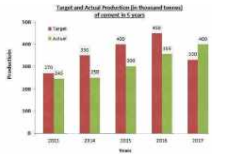
वर्ष 2014 और 2016 में सीमेंट के कुल लक्षित उत्पादन और 2013, 2016 तथा 2017 में कुल वास्तविक उत्पादन का अनुपात है :
View SolutionStudy the graph and answer the questions based on the graph:
आरेख का अध्ययन करें और आरेख के आधार पर प्रश्नों के उत्तर दें: On which day the production was 1/5 th of the total production?
किस दिन उत्पादन कुल उत्पादन का 1/5 था?
View SolutionStudy the following bar diagram and answer the question that follows.
निम्नलिखित दंड आरेख का अध्ययन करें और उस प्रश्न का उत्तर दें जो पूछा गया है। The production (in thousands) of electronic items (TV and LCD) in a factory during the period from 2011 to 2015.
2011 से 2015 की अवधि के दौरान एक कारखाने में इलेक्ट्रॉनिक वस्तुओं (TV और LCD) का उत्पादन (हजारों में)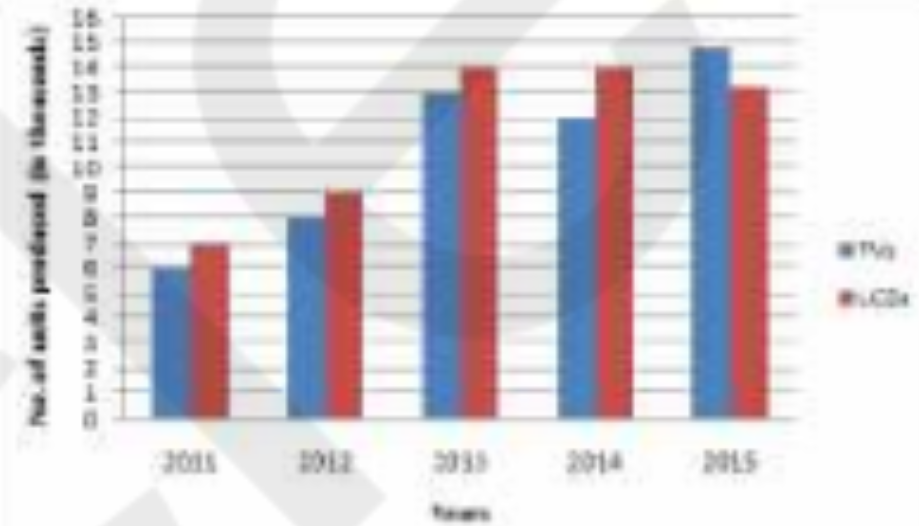 The ratio of the total production of LCDs in the year 2012 and 2014 to the total production of TV’s in the year 2012 and 2014 is:
वर्ष 2012 और 2014 में एलसीडी के कुल उत्पादन और वर्ष 2012 और 2014 में टीवी के कुल उत्पादन का अनुपात है:
View Solution
