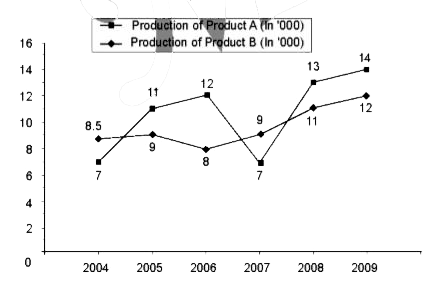
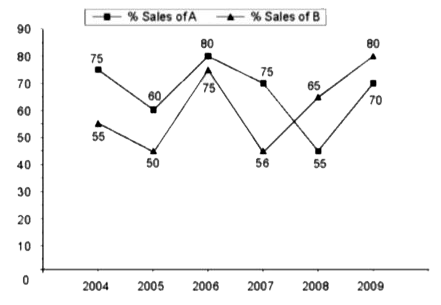
पहला लाइन ग्राफ उत्पाद A व B के लिए, 2004 से 2009 तक का उत्पादन दिखाता है व दूसरा ग्राफ प्रतिशत बिक्री दिखाता है।


उत्पाद A की वर्ष 2005 व 2009 में कुल बिक्री ज्ञात कीजिये ?
10290
13460
11500
16400
The correct Answer is:C
Step by step video, text & image solution for पहला लाइन ग्राफ उत्पाद A व B के लिए, 2004 से 2009 तक का उत्पादन दिखाता है व दूसरा ग्राफ प्रतिशत बिक्री दिखाता है। उत्पाद A की वर्ष 2005 व 2009 में कुल बिक्री ज्ञात कीजिये ? by Maths experts to help you in doubts & scoring excellent marks in Class 14 exams.
Updated on:21/07/2023Topper's Solved these Questions
Similar Questions
यदि A:B=2:3 और B:C=3:7, तो A+B:B+C:C+A क्या होगा?
View SolutionP और Q की वर्तमान आयु के बीच का क्रमशः अनुपात 3 : 4 है। चार वर्ष बाद Q, P से पाँच वर्ष बड़ा होगा।P की वर्तमान आयु कितनी है?
View SolutionHow many lines of symmetry does the above figure have ?
View SolutionWhich of the following are correct chain isomers of butane ? (i)
View SolutionDetermine the point of symmetry of a regular hexagon.
View SolutionDtermine the images of the following figure about the given line :
View SolutionMatch the following Column A to Column B

View SolutionMatch the following Column A to Column B

View SolutionMatch the following Column A to Column B

View SolutionFind the area of the figure given below.

View SolutionThe area of the shaded part in the figure given below is ______.

View SolutionThe inequation represented by the graph given below is :
View SolutionThe inequation that best describes the graph given below is _________
View SolutionThe inequation that best describes the following graph is _________
View SolutionWhich inequations represent the shaded region in the given figure
View SolutionIn the chemical reactions,
ltimg src="https://d10lpgp6xz60nq.cloudfront.net/physics_images/JM_10_CHE_P1_E01_009_S01.png" width="80%"gt
the compounds 'A' and 'B' respectively are
View Solution
