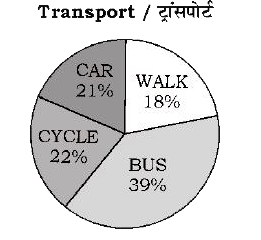
दिए गए पाई-चार्ट में परिवहन के विभिन्न तरीको का उपयोग करके स्कूल आने वाले छात्रों के प्रतिशत को दर्शाया गया है। छात्रों की कुल संख्या =1300
 बस और पैदल यात्रा करने वाले छात्रों की संख्या और कार और साइकिल से यात्रा करने वाले छात्रों की संख्या के बीच का अंतर क्या है ?
182
364
125
142
The correct Answer is:A
Step by step video, text & image solution for दिए गए पाई-चार्ट में परिवहन के विभिन्न तरीको का उपयोग करके स्कूल आने वाले छात्रों के प्रतिशत को दर्शाया गया है। छात्रों की कुल संख्या =1300 बस और पैदल यात्रा करने वाले छात्रों की संख्या और कार और साइकिल से यात्रा करने वाले छात्रों की संख्या के बीच का अंतर क्या है ? by Maths experts to help you in doubts & scoring excellent marks in Class 14 exams.
Topper's Solved these Questions
Similar Questions
यदि A:B=2:3 और B:C=3:7, तो A+B:B+C:C+A क्या होगा?
06:14View SolutionP और Q की वर्तमान आयु के बीच का क्रमशः अनुपात 3 : 4 है। चार वर्ष बाद Q, P से पाँच वर्ष बड़ा होगा।P की वर्तमान आयु कितनी है?
04:15View Solutionयह ज्ञात है की महाविद्यालय के छात्रों में से 60 % छात्रावास में रहते है और 40 % छात्रावास में नहीं रहते है । पूर्ववर्ती वर्ष से परिणाम सूचित करते है की छात्रावास में रहने वाले छात्रों में से30 % छात्रों में से 20 % छात्रों ने A ग्रेड लिए। वर्ष के अंत में महाविद्यालय के एक छात्र को यादृच्छया चुना गया और पाया गया की उसे A ग्रेड मिला है । इस बात की क्या प्रायिकता है की वह छात्रावास में रहने वाला है ?
03:58View Solutionदो कक्षाओं की एक ही तरह की परीक्षा ली गई। 120 छात्रों की पहली कक्षा के छात्रों के प्राप्तांकों का माध्य 80% और तीस छात्रों की दूसरी कक्षा के छात्रों के प्राप्तांकों का माध्य 70% आया। दोनों कक्षाओं के सभी छात्रों के प्रतिशत प्राप्तांकों का माध्य होगा
03:07View SolutionThe following table shows the number of students of 7 college participating in extra curricular activities: निम्न सारणी उन कॉलेजों के छात्रों की संख्या दर्शाती है, जो पाठ्येत्तर क्रियाकलापों में भाग लेते हैं। Read the table and answer the following question. तालिका पढ़ें और निम्नलिखित प्रश्नों के उत्तर दें। Percentage of the number of students in activity II to that of IV is क्रियाकलाप II में छात्रों की संख्या का क्रियाकलाप IV में छात्रों की संख्या के साथ प्रतिशत है-
03:03View SolutionThe total number of students in section A and B of a class is 110. The number of students in section A is 10 more than that of section B. The average score of the students in B, in a test, is 20% more than that of students in A. If the average score of all the students in the class is 72, then what is the average score of the students in A?
किसी कक्षा के खंड A और खंड B के छात्रों की कुल संख्या 110 है | खंड A में छात्रों की संख्या खंड 9 के छात्रों की संख्या से 10 अधिक है| किसी परीक्षा में B के छात्रों का औसत प्राप्तंक A के छात्रों के औसत प्राप्तंक से 20% अधिक है | यदि सभी छात्रों का औसत प्राप्तांक 72 है, तो A के छात्रों का औसत प्राप्तांक ज्ञात करें |03:52View SolutionThe total number of students in class A and B is 96. The number of students in A is 40% more than that in B. The average weight (in kg) of the students in B is 50% more than that of the students in A. If the average weight of all the students in A and B taken together is 58 kg, then what is the average weight of the students in B?
कक्षा A और कक्षा B के कुल छात्रों की संख्या 96 है | A के छात्रों की संख्या B के छात्रों से 40% अधिक है | B कक्षा के छात्रों का औसत वज़न A के छात्रों के औसत वज़न से 50% अधिक है | यदि A और B दोनों के छात्रों का कुल औसत वज़न 58 किलो ग्राम है, तो B के छात्रों का औसत वज़न ज्ञात करें |02:47View SolutionThe number of students in classes A and B are 60 and 70, respectively. The average score in mathematics of students in B is 57 and that of all students in A and B is 63. What is the average score of students in A?
कक्षा A और B में छात्रों की संख्या क्रमश: 60 और 10 है | B में गणित में छात्रों का औसत अंक 57 तथा A और B के सभी छात्रों का गणित में औसत अंक 63 है |A के छात्रों का औसत अंक ज्ञात करें |02:07View SolutionThe number of students studying A, B and C in a school are in the proportion 12 : 15 : 16. There is a proposal to increase the number of students studying A, B and C, respectively by 50%, 20% and 50%. What will be the new proportion of the number of students studying A, B and C?
किसी विद्यालय में A,B तथा C की पढ़ाई करने वाले छात्रों की संख्या का अनुपात 12 : 15 : 16 है | A, B तथा C पढ़ने वाले छात्रों की संख्या को क्रमशः 50%, 20% और 50% से बढ़ाने का प्रस्ताव है | A, B और C की पढ़ाई करने वाले छात्रों की संख्या का नया अनुपात क्या होगा ?02:20View SolutionThe given graph shows the marks obtained by students in an examination.
दिया गया आरेख किसी परीक्षा में छात्रों के प्राप्तांक दर्शाता है | The number of students who obtained less than 300 marks is what percent more than the number of students who obtained 350 or more marks?
300 अंक से कम प्राप्त करने वाले छात्रों की संख्या 350 या इससे अधिक अंक प्राप्त करने वाले छात्रों की संख्या से कितना प्रतिशत अधिक है ?04:03View SolutionThis table shows the number of students studying in various streams in different colleges. निम्नलिखित तालिका पांच कॉलेजों के तीन विषयों में पढ़ने वाले छात्रों की संख्या दर्शाती है | The number of students in the science stream of college C is approximately what percentage of students studying in that college? कॉलेज C में विज्ञान विषय में छात्रों की संख्या उस कॉलेज में पढ़ने वाले छात्रों की संख्या का लगभग कितना प्रतिशत है ?
02:31View SolutionThe given Bar Graph presents the number of students enrolled for a vocational course in institutes A and B during a period of five years. दिया गया दंड आरेख A और B संस्थानों में पांच वर्षों की अवधि के दौरान व्यावसायिक पाठ्यक्रमों नामांकन लेने वाले छात्रों की संख्या को दर्शाता है | The total number of students enrolled in A during 2014, 2016 and 2018 is what percentage (correct to one decimal place) of the total number of students enrolled in B during the five years? 2014, 2016 और 2018 में A में नामांकन लेने वाले छात्रों की कुल संख्या इन पांच वर्षों के दौरान B में नामांकन लेने वाले छात्रों की कुल संख्या का कितना प्रतिशत ( एक दशमलव स्थान तक सही ) है ?
01:48View SolutionThe given Bar Graph presents the results in terms of the number of students in a school for the five academic years, 2013-2014 to 2017-2018. दिया गया दंड आरेख पांच शैक्षणिक वर्षों : 2013-2014 से 2017-2018 तक एक विद्यालय में छात्रों की संख्या के संदर्भ में परिणामों को प्रस्तुत करता है | In which academic year the difference between the number of students passed and that of those failed is the lowest? किस शैक्षणिक वर्ष में, पास करने वाले छात्रों तथा फेल करने वाले छात्रों की संख्या में सबसे कम अंतर है ?
01:38View SolutionIn the given bar graph, the percentage decrease in the number of students in Institute A in 2016 is what percent of students in 2015. इस दंड आरेख में संस्थान A में 2016 में छात्रों की संख्या में प्रतिशत कमी 2015 के छात्रों की संख्या का क्या प्रतिशत है ?
01:52View SolutionThe given pie-chart depicts the percentage of students coming to school using different modes of transport. Total number of students=1300 दिया गया पाई चार्ट परिवहन के विभिन्न साधनों का प्रयोग करके विद्यालय आने वाले छात्रों का प्रतिशत दर्शाता है | छात्रों की कुल संख्या =1300 In the given pie-chart, if 234 students used to walk, then how many come by bus ? / दिए गए पाई-चार्ट में, यदि 234 छात्र चलकर आते हैं, तो कितने छात्र बस से आते हैं?
01:10View SolutionThe given pie-chart depicts the percentage of students coming to school using different modes of transport. Total number of students=1300 दिया गया पाई चार्ट परिवहन के विभिन्न साधनों का प्रयोग करके विद्यालय आने वाले छात्रों का प्रतिशत दर्शाता है | छात्रों की कुल संख्या =1300 In the given pie-chart, the difference between the number of students travel by bus or walk to the number of students travel by car or cycle, इस पाई चार्ट के अनुसार बस सेया पैदल यात्रा करने वाले छात्रों की संख्या एवं कार अथवा साइकिल से यात्रा करने वाले छात्रों की संख्या में क्या अंतर है ?
02:32View Solution
