यह तालिका विभिन्न कॉलेजों में विभिन्न अनुशासनों में पढ़ाई कर रहे विधार्थियो की संख्या को दर्शाती है।
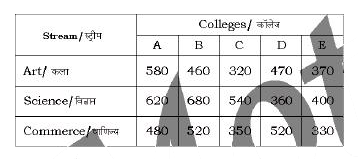
कॉलेज C के विज्ञानं अनुशासनों में विधार्थियो की संख्या उस कॉलेज में पढ़ने वाले कुल विधार्थियो का लगभग कितना प्रतिशत है ?
42%
43%
44%
45%
The correct Answer is:D
Step by step video, text & image solution for यह तालिका विभिन्न कॉलेजों में विभिन्न अनुशासनों में पढ़ाई कर रहे विधार्थियो की संख्या को दर्शाती है। कॉलेज C के विज्ञानं अनुशासनों में विधार्थियो की संख्या उस कॉलेज में पढ़ने वाले कुल विधार्थियो का लगभग कितना प्रतिशत है ? by Maths experts to help you in doubts & scoring excellent marks in Class 14 exams.
Updated on:21/07/2023Topper's Solved these Questions
Similar Questions
यदि A:B=2:3 और B:C=3:7, तो A+B:B+C:C+A क्या होगा?
View SolutionP और Q की वर्तमान आयु के बीच का क्रमशः अनुपात 3 : 4 है। चार वर्ष बाद Q, P से पाँच वर्ष बड़ा होगा।P की वर्तमान आयु कितनी है?
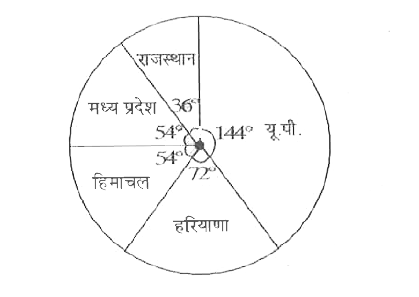
View Solutionचित्र में दिया गया वृत्त चार्ट मई -जून 2013 के दौरान वाहनों का केन्द्र्य सर्कार द्वारा चल्या गये अभियान में कटे हुए चलानो की संख्या को डिग्री (∘ ) में दर्शाता है। इसे ध्यानपूर्वक पढ़िए व निम्न प्रशनो के उत्तर दीजिए।
यदि कुल वाहनों 72 लाख है तो मध्य प्रदेश में कटे चालानों की संख्या राजस्थान के कटे चालानों की संख्या से कितना अधिक है ?

View SolutionThe table given below shows the number of applicants who have applied for exam at various centres as percentage of total number of applicants. The table also shows the number online applicants and absent applicants as a percentage of total applicants of each centre. Total number of applicants is 1200000.
नीचे दी गई तालिका में विभिन्न परीक्षा केन्द्रों में परीक्षा का नामांकन भरने वाले अभ्यर्थियों को संख्या को कुल अभ्यर्थियों की संख्या के प्रतिशत के रूप में दर्शाया गया है। यह तालिका प्रत्येक परीक्षा केन्द्र के ऑनलाइन अभ्यर्थियों तथा अनुपस्थित अभ्यर्थियों की संख्या को कुल अभ्यर्थियों की संख्या के प्रतिशत के रूप में दर्शाती है। अभ्यर्थियों की कुल संख्या 1200000 है।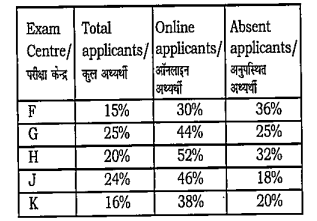 If A equals to 15% of total applicants who are present at exam centre F and B equals to
present applicants at exam centre K, then A is what percent of B?
यदि A परीक्षा केन्द्र F पर उपस्थित अभ्यर्थियों की कुल संख्या के 15% के बराबर है तथा B परीक्षा केन्द्र K पर उपस्थित अभ्यर्थियों के बराबर है, तो A, B का कितना प्रतिशत है?
View SolutionThe given table shows the number (in percent) of employees working in different depratments of an organization. The table also shows the ratio of males and females and the ratio of employees living in city Z and employees , living in city Y. The total number of employees in the organization 80,000.
दी गई तालिका में एक संगठन के विभिन्न विभागों में कार्य कर रहे कर्मचारियों की संख्या ( प्रतिशत में ) को दर्शाया गया है। यह तालिका पुरूषों तथा महिलाओं के अनुपाव को तथा शहर ,Z में रह रहे कर्मचारियों तथा शहर Y में रह रहे कर्मचारियों के अनुपात को भी दर्शाती है। संगठन रद में कुल कर्मचारियों की संख्या 80000 है।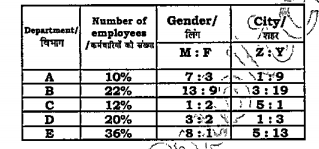 How many employees of department A and C together are living in city Z?
विभाग A तथा C के कितने कर्मचारी, शहर Z में साथ-मिलकर रह रहें है?
View SolutionThe given table shows the number (in percent) of employees working in different depratments of an organization. The table also shows the ratio of males and females and the ratio of employees living in city Z and employees , living in city Y. The total number of employees in the organization 80,000.
दी गई तालिका में एक संगठन के विभिन्न विभागों में कार्य कर रहे कर्मचारियों की संख्या ( प्रतिशत में ) को दर्शाया गया है। यह तालिका पुरूषों तथा महिलाओं के अनुपाव को तथा शहर ,Z में रह रहे कर्मचारियों तथा शहर Y में रह रहे कर्मचारियों के अनुपात को भी दर्शाती है। संगठन रद में कुल कर्मचारियों की संख्या 80000 है।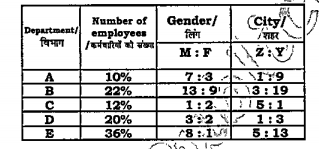 On an average how many residents of city Y are working in each department?
शहर Y के कितने निवासी औसतन एक विभाग में कार्य कर रहे है?
View SolutionThe given table shows the number (in percent) of employees working in different depratments of an organization. The table also shows the ratio of males and females and the ratio of employees living in city Z and employees , living in city Y. The total number of employees in the organization 80,000.
दी गई तालिका में एक संगठन के विभिन्न विभागों में कार्य कर रहे कर्मचारियों की संख्या ( प्रतिशत में ) को दर्शाया गया है। यह तालिका पुरूषों तथा महिलाओं के अनुपाव को तथा शहर ,Z में रह रहे कर्मचारियों तथा शहर Y में रह रहे कर्मचारियों के अनुपात को भी दर्शाती है। संगठन रद में कुल कर्मचारियों की संख्या 80000 है।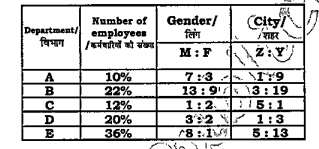 what are the total number of employee in department A and E together?
विभाग A तथा E में मिलाकर कुल कर्मचारियों की संख्या क्या है?
View SolutionThe following table shows the number of students of 7 college participating in extra curricular activities: निम्न सारणी उन कॉलेजों के छात्रों की संख्या दर्शाती है, जो पाठ्येत्तर क्रियाकलापों में भाग लेते हैं। Read the table and answer the following question. तालिका पढ़ें और निम्नलिखित प्रश्नों के उत्तर दें। Percentage of the number of students in activity II to that of IV is क्रियाकलाप II में छात्रों की संख्या का क्रियाकलाप IV में छात्रों की संख्या के साथ प्रतिशत है-
View SolutionThe table below shows the number of students enrolled in five colleges over the five years (2010 to 2014). यह तालिका पांच कॉलेजों में पांच वर्षों ( 2010 से 2014 ) के दौरान नामांकन लेने वाले छात्रों की संख्या दर्शाती है | What is the average number of students studying in college D over the given years? इन वर्षों में कॉलेज D में पढ़ने वाले छात्रों की औसत संख्या कितनी है ?
View SolutionThe table below shows the number of students enrolled in five colleges over the five years (2010 to 2014). यह तालिका पांच कॉलेजों में पांच वर्षों ( 2010 से 2014 ) के दौरान नामांकन लेने वाले छात्रों की संख्या दर्शाती है | What is the ratio of the total students enrolled in colleges A and B in the year 2012 to the total students enrolled in colleges D and E in the year 2013? वर्ष 2012 में कॉलेज A और B में नामांकन लेने वाले कुल छात्रों की संख्या का वर्ष 2013 में कॉलेज D और E में नामांकन लेने वाले कुल छात्रों की संख्या के साथ अनुपात ज्ञात करें|
View SolutionThe table below shows the number of students enrolled in five colleges over the five years (2010 to 2014). यह तालिका पांच कॉलेजों में पांच वर्षों ( 2010 से 2014 ) के दौरान नामांकन लेने वाले छात्रों की संख्या दर्शाती है | The number of students studying in college E in the year 2013 is approximately what percent of the number of students studying in colleges B, C and D taken together in the year 2013 (nearest to one decimal place) वर्ष 2013 में कॉलेज E में पढ़ रहे छात्रों की संख्या वर्ष 2013 में कॉलेज B, C एवं D में पढ़ने वाले छात्रों की कुल संख्या का लगभग कितना प्रतिशत है ? ( एक दशमलव स्थान के निकटतम )
View SolutionThe following table indicates the number of students studying in three disciplines in five colleges: निम्नलिखित तालिका पांच कॉलेजों के तीन विषयों में पढ़ने वाले छात्रों की संख्या दर्शाती है | What percentage of total students are studying in the commerce stream in all five colleges together? कुल छात्रों में से कितने प्रतिशत छात्र सभी पांच कॉलेजों में कॉमर्स विषय की पढ़ाई कर रहे हैं ?
View SolutionThis table shows the number of students studying in various streams in different colleges. निम्नलिखित तालिका पांच कॉलेजों के तीन विषयों में पढ़ने वाले छात्रों की संख्या दर्शाती है | The number of students in the science stream of college C is approximately what percentage of students studying in that college? कॉलेज C में विज्ञान विषय में छात्रों की संख्या उस कॉलेज में पढ़ने वाले छात्रों की संख्या का लगभग कितना प्रतिशत है ?
View SolutionThe following table shows the percentage distribution of students in various disciplines from five different colleges. निम्नलेखित तालिका पांच अलग-अलग कॉलेजों के विभिन्न विषयों में छात्रों का प्रतिशत वितरण दर्शाती है | If the data of the total students’ college wise, is represented by a pie-chart, what is the central angle of the sector representing college E (to nearest whole number)? यदि कॉलेज वार कुल छात्रों के आंकड़ों को एक पाई-चार्ट में प्रस्तुत किया जाए, तो कॉलेज E को दर्शन वाले खंड का केंद्रीय कोण क्या होगा ? ( निकटतम पूर्ण संख्या में )
View SolutionThe Table shows the Number of Laptops and Desktops manufactured by a company. यह तालिका किसी कंपनी के द्वारा निर्मित लैपटॉप एवं डेस्कटॉप की संख्या को दर्शाती है | What was the difference in the total number of Laptops and Desktops manufactured in 2009 to the total number of Laptops and Desktops manufactured in 2011? 2009 में निर्मित लैपटॉप तथा डेस्कटॉप की कुल संख्या तथा 2011 में निर्मित लैपटॉप और डेस्कटॉप की कुल संख्या में क्या अंतर है ?
View Solution
