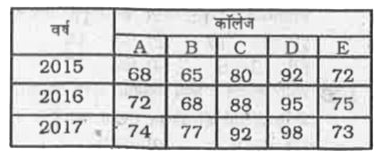
यह तालिका तीन वर्ष के दौरान पाँच अलग - अलग कॉलेजों के उत्तीर्ण विद्यार्थियों के प्रतिशत को दर्शाती है। यह दिया है कि प्रत्येक कॉलेज से हर वर्ष 200 विद्यार्थी परीक्षा में बैठे थे ?

वर्ष 2015 में कॉलेज E के उत्तीर्ण और अनुत्तीर्ण विद्यार्थियों का अनुपात क्या है ?
4:3
18:7
9:5
17:7
The correct Answer is:B
Step by step video, text & image solution for यह तालिका तीन वर्ष के दौरान पाँच अलग - अलग कॉलेजों के उत्तीर्ण विद्यार्थियों के प्रतिशत को दर्शाती है। यह दिया है कि प्रत्येक कॉलेज से हर वर्ष 200 विद्यार्थी परीक्षा में बैठे थे ? वर्ष 2015 में कॉलेज E के उत्तीर्ण और अनुत्तीर्ण विद्यार्थियों का अनुपात क्या है ? by Maths experts to help you in doubts & scoring excellent marks in Class 14 exams.
Updated on:21/07/2023Topper's Solved these Questions
Similar Questions
यदि A:B=2:3 और B:C=3:7, तो A+B:B+C:C+A क्या होगा?
View SolutionP और Q की वर्तमान आयु के बीच का क्रमशः अनुपात 3 : 4 है। चार वर्ष बाद Q, P से पाँच वर्ष बड़ा होगा।P की वर्तमान आयु कितनी है?
View Solutionयह ज्ञात है की महाविद्यालय के छात्रों में से 60 % छात्रावास में रहते है और 40 % छात्रावास में नहीं रहते है । पूर्ववर्ती वर्ष से परिणाम सूचित करते है की छात्रावास में रहने वाले छात्रों में से30 % छात्रों में से 20 % छात्रों ने A ग्रेड लिए। वर्ष के अंत में महाविद्यालय के एक छात्र को यादृच्छया चुना गया और पाया गया की उसे A ग्रेड मिला है । इस बात की क्या प्रायिकता है की वह छात्रावास में रहने वाला है ?
View SolutionThe following line diagram represents the yearly sales figure of a company in the years 2001-2010. Examine the diagram and answer the question. निम्नलिखित रेखा आरेख किसी कंपनी की वर्ष 2007-2010 के दौरान वार्षिक बिक्री के आंकड़ों को दर्शाता है। आरेख का अध्ययन करें और नीचे दिए गए प्रश्नों के उत्तर दें- The ratio of sales in 2002 to that in 2007 is वर्ष 2002 में बिक्री का वर्ष 2007 में बिक्री के साथ अनुपात है-
View Solutionअलग-अलग जगहों पर खड़िया-पट्टी के अलग-अलग नामों में से एक है
View Solutionराजस्थान में कुंईखोदने वालों को वर्ष भर सम्मानित करने की प्रथा है जिसे हम के नाम से जाना जाता है।
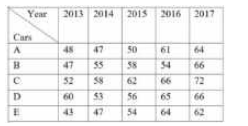
View SolutionThe table shows the production of different types of cars (in thousands). यह तालिका अलग-अलग प्रकार के कारों का उत्पादन ( हज़ार में) दर्शाती है | The number of years, in which the production of cars of type B is less than the average production of type D cars over the years is: कितने वर्ष B प्रकार की कारों का उत्पादन इन वर्षों के दौरान D प्रकार की कारों के औसत उत्पादन से कम रहा है ?
View SolutionThe table below shows the percentage of students and the ratio of boys and girls in different colleges. Total students = 1800 नीचे दी गयी तालिका छात्रों का प्रतिशत तथा अलग-अलग कॉलेजों में लड़कों एवं लड़कियों का अनुपात दर्शाती है | कुल छात्र - 1800 If 10% of the girls from college A are transferred to college E, then what is the increase in the percentage of girls in college E ? यदि कॉलेज A की 10% लड़िकयाँ कॉलेज E में स्थानांतरित कर दी जाएँ, तो कॉलेज E में लड़कियों के प्रतिशत में कितनी वृद्धि होगी ?
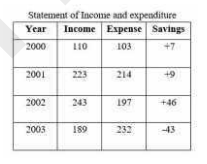
View SolutionThe table shows Income and expenditure of a person for 3 years (in thousands)
यह तालिका 3 वर्षों के दौरान किसी व्यक्ति के आय एवं व्यय (हज़ार में ) को दर्शाती है | In the given table, what is the percentage of expenditure on income in the year 2002? (round
off)
दी गयी तालिका के अनुसार, वर्ष 2002 में आय पर व्यय का प्रतिशत कया है?
View SolutionThe table shows the production of different types of cars (in thousands).
यह तालिका एक कंपनी द्वारा अलग-अलग कारों के उत्पादन ( हज़ार में ) को दर्शाती है | The total production of type B cars during 2013 to 2016 is approximately what percent less than the total production of cars in 2017?
2013 से 2016 के दौरान B प्रकार की कारों का कुल उत्पादन 2017 में कारों के कुल उत्पादन से लगभग कितना प्रतिशत कम है ?
View SolutionThe table shows the production of different types of cars (in thousands). यह तालिका एक कंपनी द्वारा अलग-अलग कारों के उत्पादन (हज़ार में ) को दर्शाती है | The average production of type A cars during the five years is what percent of the total production of type C cars during the five years? पांच वर्षों के दौरान A प्रकार की कारों का औसत उत्पादन पांच वर्षों के दौरान C प्रकार की कारों के कुल उत्पादन का कितना प्रतिशत है ?
View SolutionThis table shows the percentage of students passing out of five different colleges over three years. It is given that from each college, 200 students appeared every year. यह तालिका तीन वर्षों में पांच अलग-अलग कॉलेजों से पास करने वाले छात्रों का प्रतिशत दर्शाती है | यह दिया गया है कि प्रत्येक कॉलेज से हर वर्ष 200 छात्र शामिल हुए | What is the approximate percentage increase in the number of students passing out of college B in the year 2017 as compared to the previous year? कॉलेज B से वर्ष 2017 में पास करने वाले छात्रों की संख्या में पिछले वर्ष की तुलना में लगभग कितने प्रतिशत की वृद्धि हुई है ?
View SolutionThis table shows the percentage of students passing out of five different colleges over three years. It is given that from each college, 200 students appeared every year. यह तालिका तीन वर्षों में पांच अलग-अलग कॉलेजों से पास करने वाले छात्रों का प्रतिशत दर्शाती है | यह दिया गया है कि प्रत्येक कॉलेज से हर वर्ष 200 छात्र शामिल हुए | In which college the average percentage of passing students over the given three years is the least? किस कॉलेज में दिए गए तीन वर्षों के दौरान पास करने वाले छात्रों का औसत प्रतिशत सबसे कम रहा है ?
View SolutionThis table shows the percentage of students passing out of five different colleges over three years. It is given that from each college, 200 students appeared every year. यह तालिका तीन वर्षों में पांच अलग-अलग कॉलेजों से पास करने वाले छात्रों का प्रतिशत दर्शाती है | यह दिया गया है कि प्रत्येक कॉलेज से हर वर्ष 200 छात्र शामिल हुए | What is the ratio of the number of students passing to those failing from college E in the year 2015? वर्ष 2015 में कॉलेज E से पास करने वाले छात्रों की संख्या का फेल करने वाले छात्रों की संख्या के साथ अनुपात ज्ञात करें |
View SolutionThe bar graph given below shows the profit (in multiples of thousand rupees) of a company during the year 2010-2018. The average profit for the year 2015-2017 is what percentage more than the 2012 profit? नीचे दिए गए दंड आरेख में वर्ष 2010-2018 के दौरान किसी कंपनी के लाभ (हजार रुपए के गुणक में) को दर्शाया गया है | वर्ष 2015-2017 का औसत लाभ 2012 के लाभ से कितना प्रतिशत अधिक है ?
View SolutionThe given Bar Graph presents the Revenue and Expenditure (in crores of Rupees ) of a company during the five year period , 2014 - 2018. दिया गया दंड आरेख (bar graph) 5 वर्ष की अवधि 2014-2018 के दौरान किसी कंपनी के राजस्व और व्यय (करोड़ रुपए में ) को दर्शाता है। The expenditure of the company in 2017 is what percentage less than the average revenue ( per year ) in 2014, 2015 and 2016 ? वर्ष 2017 में कंपनी का व्यय, वर्ष 2014, 2015 और 2016 में औसत राजस्व (प्रति वर्ष) से कितने प्रतिशत कम है?
View Solution
