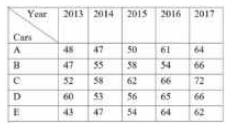
वर्ष 2014 में कॉलेज C में कितने प्रतिशत विधार्थी दाखिल हुए ? (दशमलव के एक स्थान तक सही)
16.9%
17.8%
16.7%
19.1%
The correct Answer is:B
Step by step video, text & image solution for वर्ष 2014 में कॉलेज C में कितने प्रतिशत विधार्थी दाखिल हुए ? (दशमलव के एक स्थान तक सही) by Maths experts to help you in doubts & scoring excellent marks in Class 14 exams.
Updated on:21/07/2023Topper's Solved these Questions
Similar Questions
यदि A:B=2:3 और B:C=3:7, तो A+B:B+C:C+A क्या होगा?
View SolutionP और Q की वर्तमान आयु के बीच का क्रमशः अनुपात 3 : 4 है। चार वर्ष बाद Q, P से पाँच वर्ष बड़ा होगा।P की वर्तमान आयु कितनी है?
View Solutionऊँचाई एवं दूरी Revision | ऊंचाई एवं दूरी के बोर्ड्स के पिछले वर्ष में आये हुए प्रश्न
View Solutionभिन्न संख्याओं तथा दशमलव भिन्न को प्रतिशत में बदलना सीखें
View Solutionप्रतिशत को साधारण भिन्न या दशमलव में बदलना तथा अनुमान के साथ मनोरंजन
View SolutionThe price of sugar has increased by 22%. A person wants to increase his expenditure by 12% only. By what percent should he decrease his consumption, nearest to one decimal place?
चीनी की कीमत 22% बढ़ जाती है | एक व्यक्ति अपने व्यय में केवल 12% की वृद्धि करना चाहता है | उसे अपनी खपत में कितने प्रतिशत की कमी ( एक दशमलव स्थान तक सही) करनी चाहिए ?
View SolutionA person purchased a vehicle for Rs. 5,90,828 and sold it for Rs. 6,52,920. What is the profit percent he earned on this vehicle (correct to two decimal places)?
एक व्यक्ति ने 5,90,828 रुपये में एक वाहन ख़रीदा और इसे 6,52,920 रुपये में बेच दिया | इस वाहन पर उसे कितने प्रतिशत ( दशमलव के दो स्थान तक ) का लाभ हुआ ?
View SolutionThe table shows the production of different types of cars (in thousands).
यह तालिका एक कंपनी द्वारा अलग-अलग कारों के उत्पादन ( हज़ार में ) को दर्शाती है | The total production of type B cars in 2015 and type C cars in 2013 is what percent more than the total production of type E cars in 2013 and 2014 ? (Correct to one decimal place)
2015 में B प्रकार तथा 2013 में प्रकार की कारों का कुल उत्पादन 2013 तथा 2014 में E प्रकार की कारों के कुल उत्पादन से कितना प्रतिशत अधिक है ? (एक दशमलव स्थान तक)
View SolutionThe table below shows the number of students enrolled in five colleges over the five years (2010 to 2014). यह तालिका पांच कॉलेजों में पांच वर्षों ( 2010 से 2014 ) के दौरान नामांकन लेने वाले छात्रों की संख्या दर्शाती है | In the year 2014, what percent of students were enrolled in college C (correct to one decimal place)? वर्ष 2014 में, कितने प्रतिशत छात्रों ने कॉलेज C में नामांकन करवाया था ? ( एक दशमलव स्थान तक )
View SolutionThe table below shows the number of students enrolled in five colleges over the five years (2010 to 2014). यह तालिका पांच कॉलेजों में पांच वर्षों ( 2010 से 2014 ) के दौरान नामांकन लेने वाले छात्रों की संख्या दर्शाती है | The number of students studying in college E in the year 2013 is approximately what percent of the number of students studying in colleges B, C and D taken together in the year 2013 (nearest to one decimal place) वर्ष 2013 में कॉलेज E में पढ़ रहे छात्रों की संख्या वर्ष 2013 में कॉलेज B, C एवं D में पढ़ने वाले छात्रों की कुल संख्या का लगभग कितना प्रतिशत है ? ( एक दशमलव स्थान के निकटतम )
View SolutionThe following table indicates the number of students studying in three disciplines in five colleges: निम्नलिखित तालिका पांच कॉलेजों के तीन विषयों में पढ़ने वाले छात्रों की संख्या दर्शाती है | What percentage of students in college B is studying in the science stream, (correct to one decimal place)? कॉलेज B के कितने प्रतिशत छात्र विज्ञान विषय में पढ़ रहे हैं ? ( एक दशमलव स्थान तक )
View SolutionThe table shows the number of cars sold by three showrooms over a period of six years. यह तालिका तीन शोरूम द्वारा छः वर्षों की अवधि में बेची गयी कारों की संख्या दर्शाती है | By what percent did the total number of cars sold by all three showrooms decrease during the year 2016, as compared to that in the year 2015 (nearest to one decimal place)? वर्ष 2015 की तुलना में वर्ष 2016 में तीनों शोरूम के द्वारा बेची गयी कारों की कुल संख्या में कितने प्रतिशत की कमी आयी है ? (एक दशमलव स्थान के निकटतम )
View SolutionIn the following table, the production of various crops (in tonnes) is given from 2015 to 2019. Study the table and answer the question that follows:
दी गयी तालिका में, 2015 से 2019 तक विभिन्न फसलों का उत्पादन (टन में ) दिया गया है | इस तालिका का अध्ययन करें तथा फिर पूछे गए प्रश्न का उत्तर दीजिए | The percentage growth of maize in the year 2019 over the year 2015 is: (correct to one decimal place)
वर्ष 2019 में वर्ष 2015 की तुलना में मक्का के उत्पादन में कितने प्रतिशत की वृद्धि हुई है ? ( दशमलव के एक स्थान तक )
View SolutionIn a particular year, the number of students enrolled in different streams in a college is as follows:
एक विशेष वर्ष में, किसी कॉलेज के विभिन्न विषयों में नामांकित छात्रों की संख्या इस प्रकार है : The percentage of girl students is:
छात्राओं का प्रतिशत है :
View SolutionStudy the graph and answer the question that follows
आरेख का अध्ययन करें और प्रश्न का उत्तर दे।
By what percent were the total export of the computers by the company in 2013, 2014 and 2018 less than the total production of computers in 2015 to 2017 (correct to one decimal place)?
कंपनी द्वारा वर्ष 2013, 2014 और 2018 में कंप्यूटर के कुल उत्पादन की तुलना में वर्ष 2015 से 2017 का कुल निर्यात कितने प्रतिशत कम था? (एक दशमलव स्थान तक )
View SolutionThe given Bar Graph presents the Revenue and Expenditure (in crores of Rupees ) of a company during the five year period , 2014 - 2018. दिया गया दंड आरेख (bar graph) 5 वर्ष की अवधि 2014-2018 के दौरान किसी कंपनी के राजस्व और व्यय (करोड़ रुपए में ) को दर्शाता है। The expenditure of the company in 2017 is what percentage less than the average revenue ( per year ) in 2014, 2015 and 2016 ? वर्ष 2017 में कंपनी का व्यय, वर्ष 2014, 2015 और 2016 में औसत राजस्व (प्रति वर्ष) से कितने प्रतिशत कम है?
View Solution
