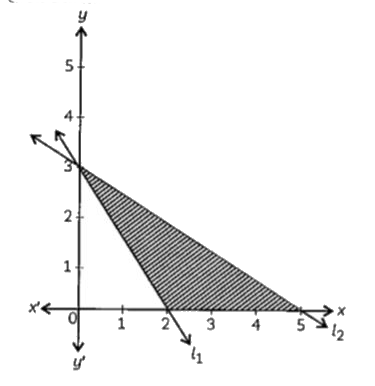
The graph of which inequality is shown below: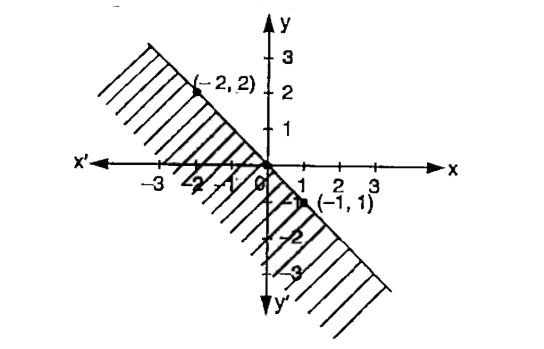
A
y−x≤0
B
x−y≤0
C
y+x≤0
D
None of the above
Video Solution
Text Solution
The correct Answer is:C
|
Answer
Step by step video, text & image solution for The graph of which inequality is shown below: by Maths experts to help you in doubts & scoring excellent marks in Class 8 exams.
Updated on:21/07/2023Topper's Solved these Questions
- LINEAR INEQUALITIESBOOK - S CHAND IIT JEE FOUNDATIONCHAPTER - LINEAR INEQUALITIESEXERCISE - QUESTION BANK -13
20 Videos
- LINEAR EQUATIONS IN ONE VARIABLE (REVISION)BOOK - S CHAND IIT JEE FOUNDATIONCHAPTER - LINEAR EQUATIONS IN ONE VARIABLE (REVISION)EXERCISE - Self Assessment Sheet
10 Videos
- MATRICES BOOK - S CHAND IIT JEE FOUNDATIONCHAPTER - MATRICES EXERCISE - UNIT TEST -2
20 Videos
Similar Questions
Knowledge Check
The graph of inequality 3x+y≤3 is:
Aclosed half plane that contains the origin.Bopen half plane that contains the origin.Copen half plane not containing the origin.Dclosed half plane not containing the origin.The graph of the inequality ax+by gt c is represented by shading in the …A…. .Here, A refers to
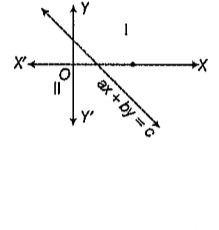 Ahalf plane I including the point on ax+by=cBhalf plane II including the point on ax+by=cChalf plane I not including the point on ax+by=cDhalf plane II not including the point on ax+by =c
The displacement-time graph of a particle is as shown below. It indicates that
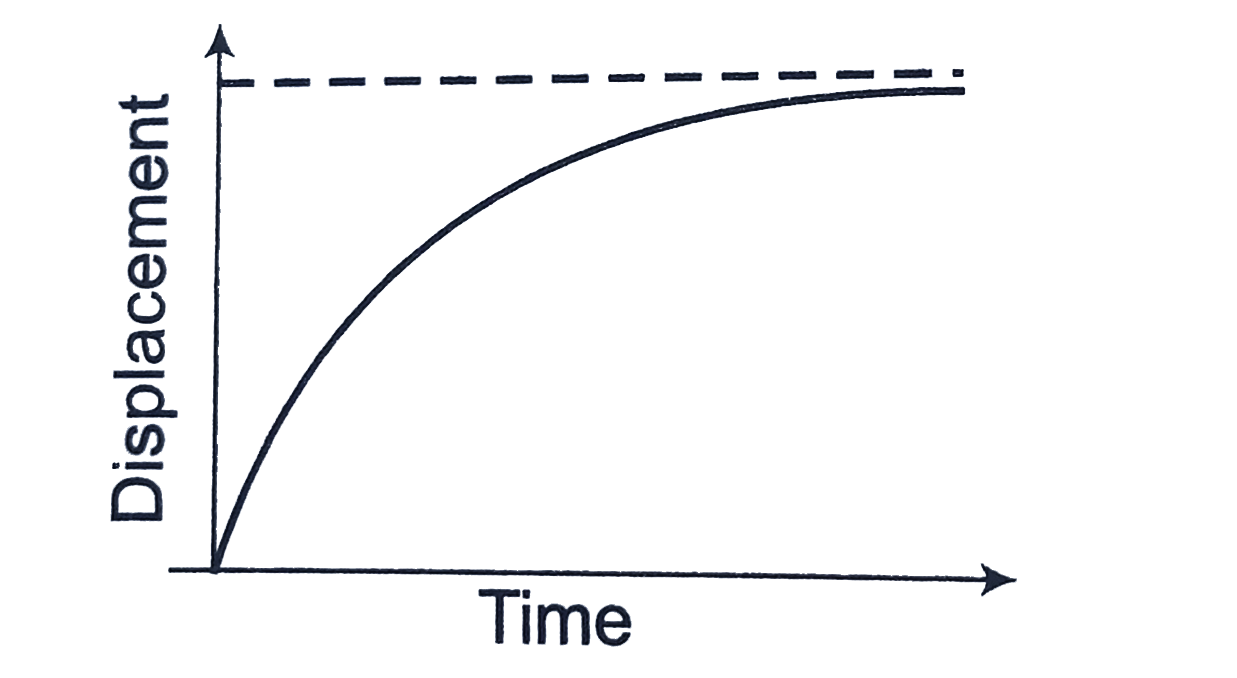 Athe particle starts with a certain velocity but the motion is retarded and finally the particle stopsBthe velocity of the particle is constant throufgoutCthe acceleration of the particle is constant throughoutDthe particle starts with a velocity, the motion is accelerated and finally the particle moves with a constant velocity
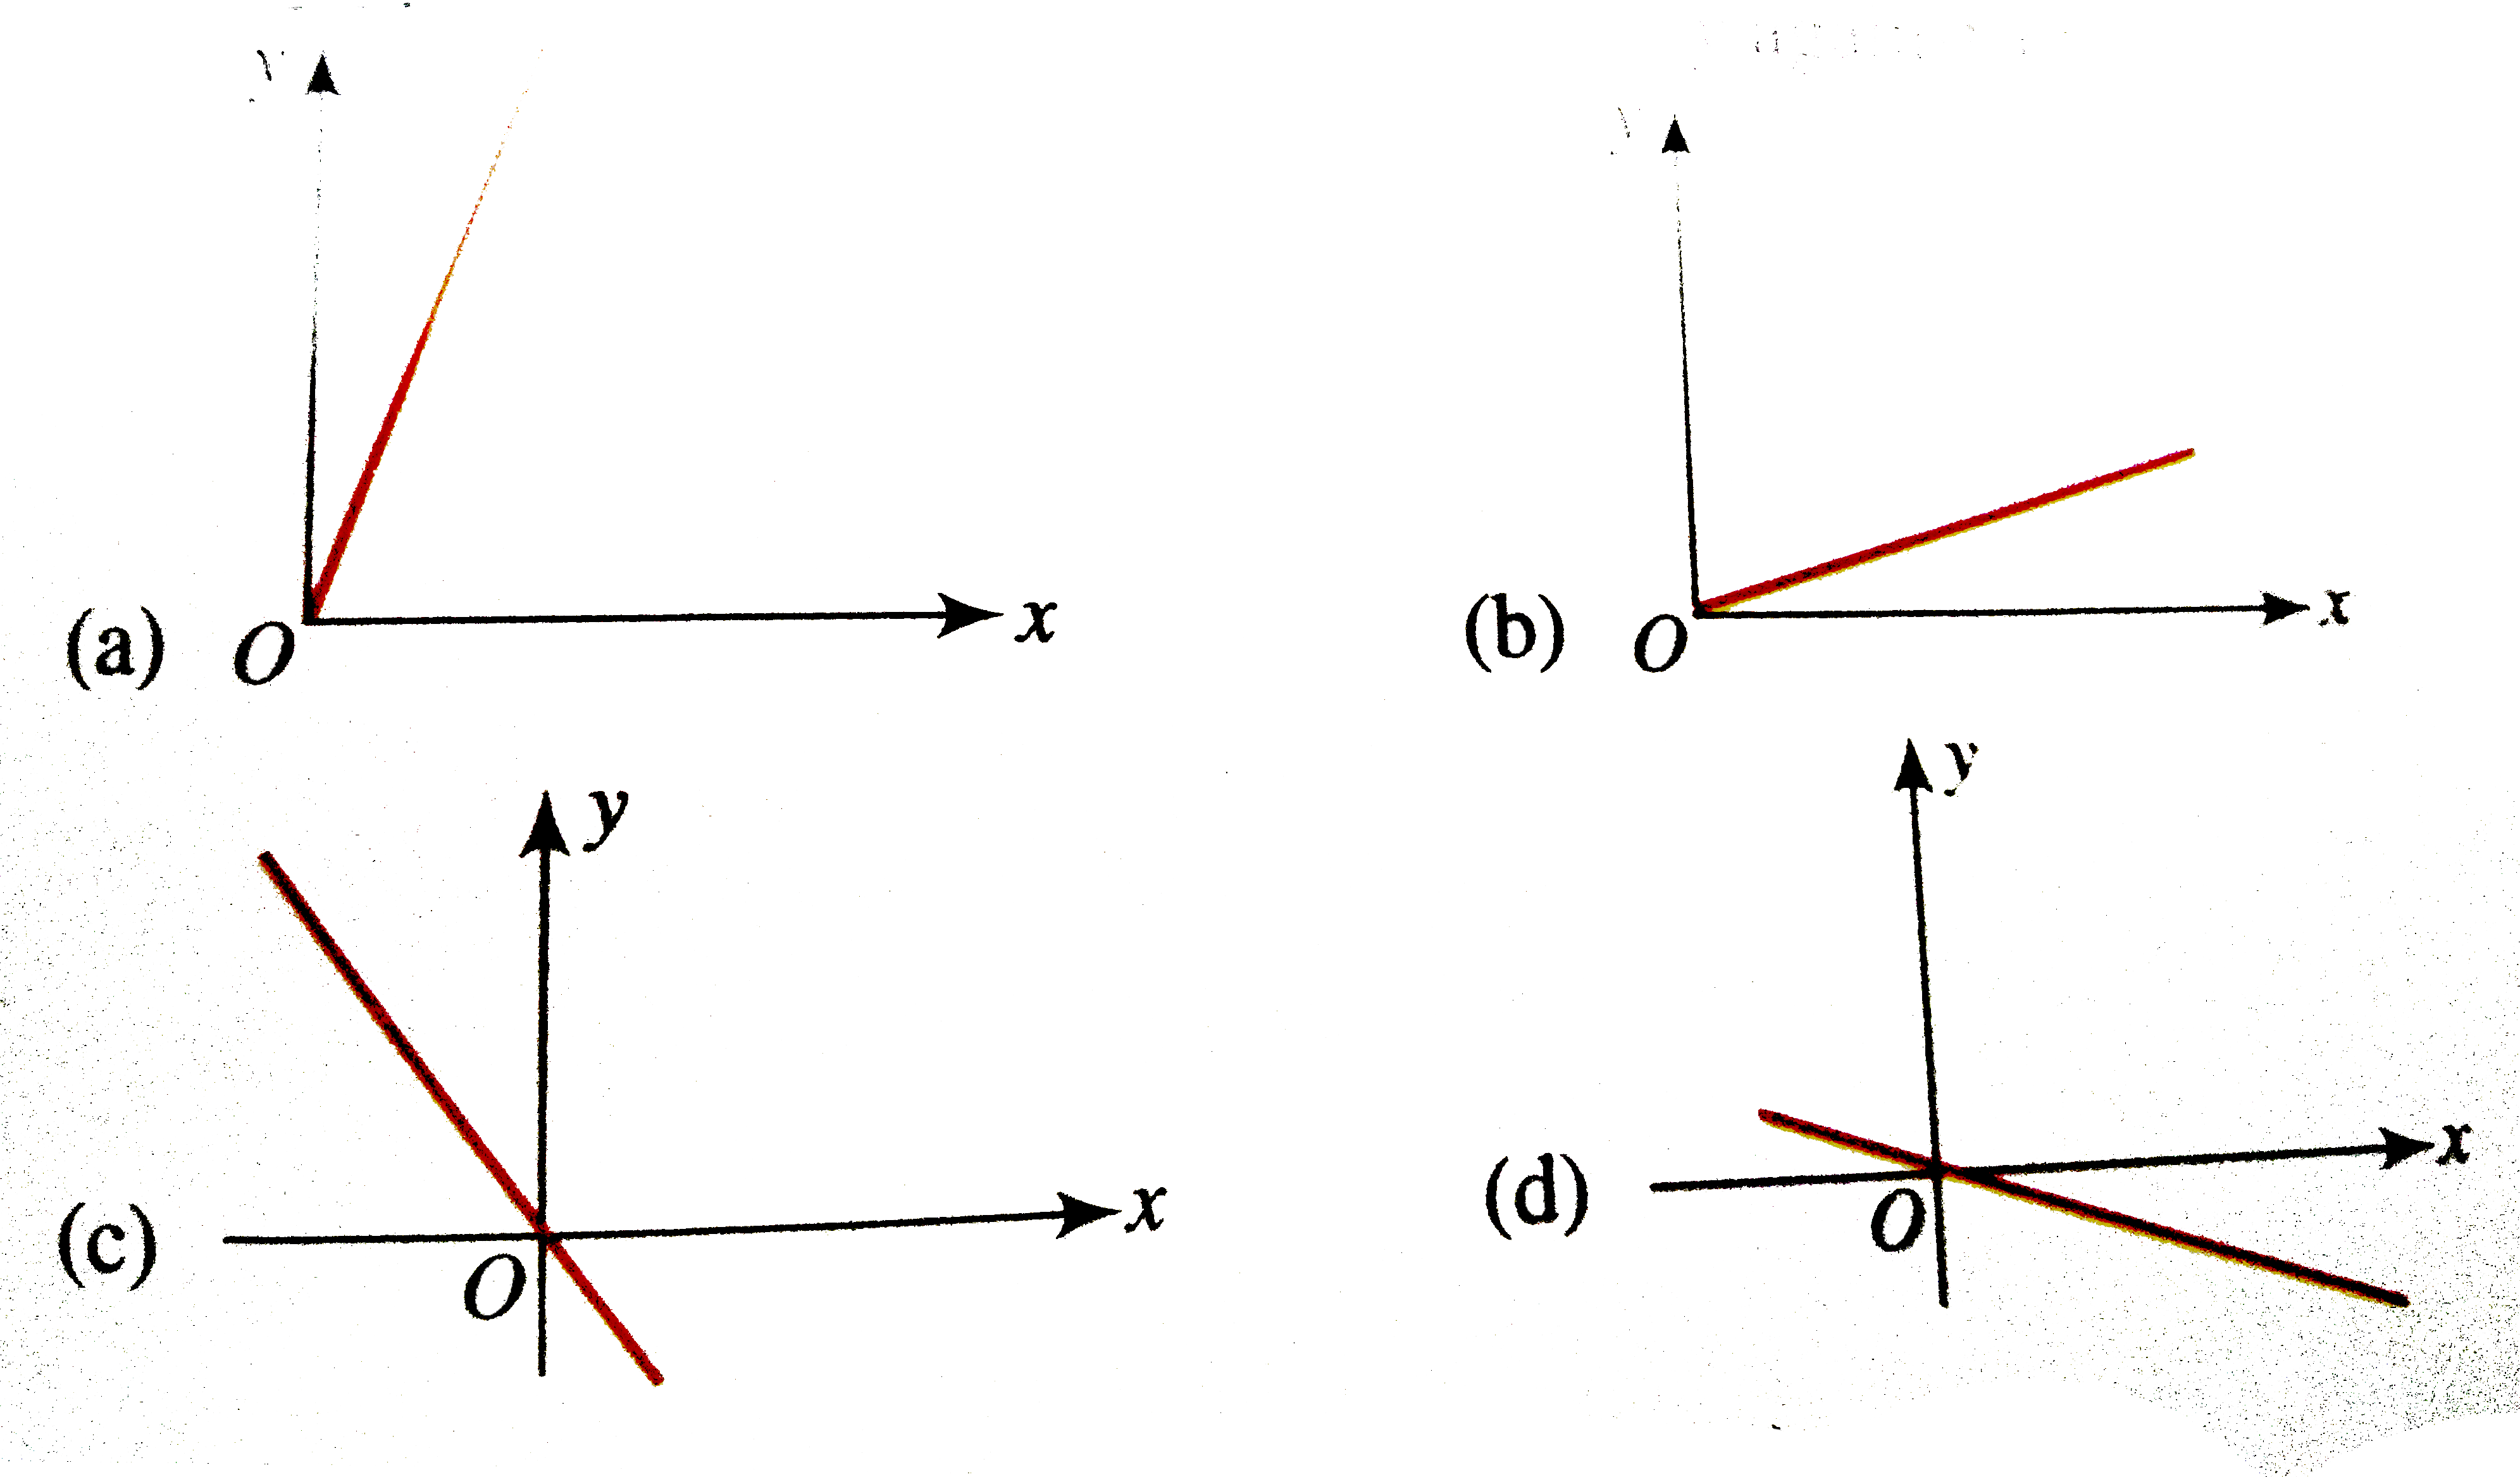
The graph of (y−x) against (y+x) is shown below.
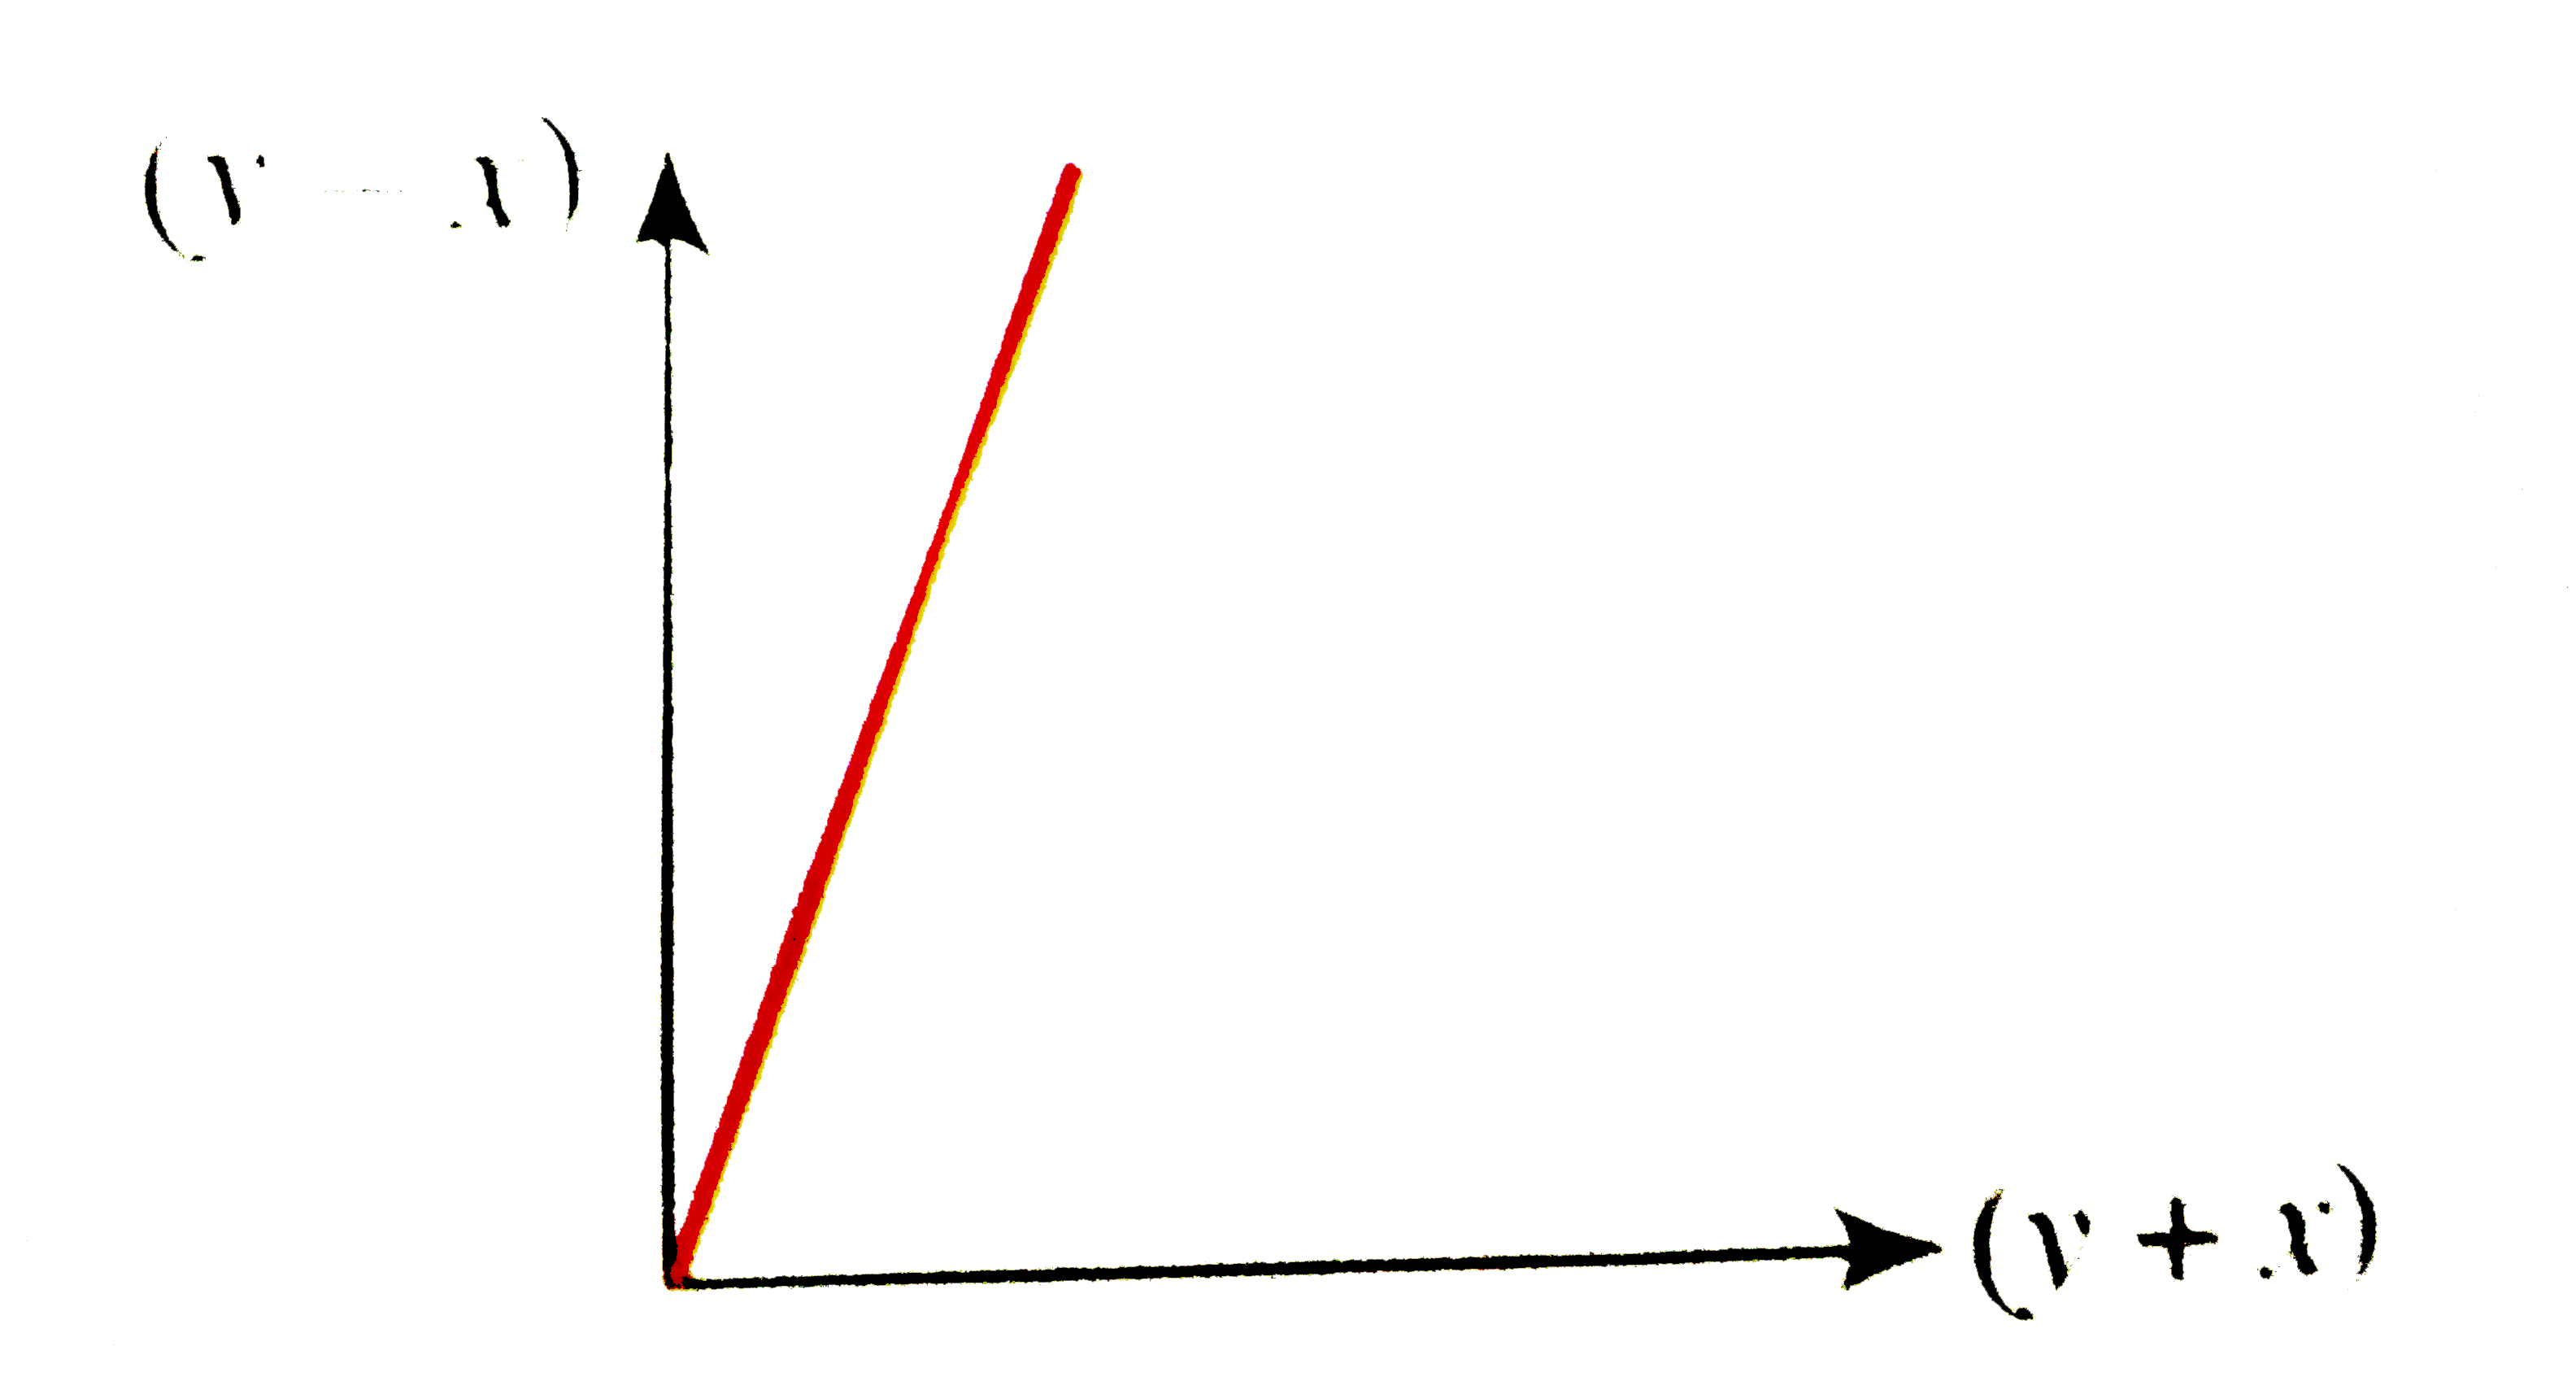
Which one of the following shows the graph of y against x ?
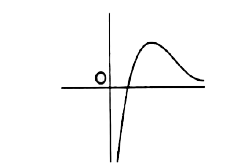
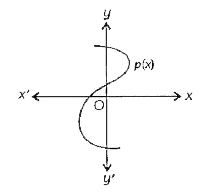
View SolutionCalculate the number of zeroes for the graph of a polynomial p(x) as shown below:
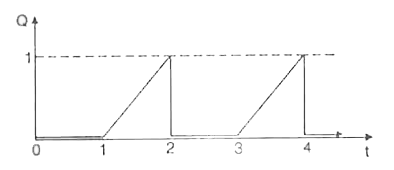
View SolutionDraw graphs of the speeds and path lengths as functions of time if the graph of acceleration is as shown below . The initial speed is zero .
View SolutionThe feasible region of a sytem of linear inequations is shown below. If Z = 2x + y, then the minimum value of Z is:
View SolutionDraw the graphs of the inequality y≤x.
View Solution

