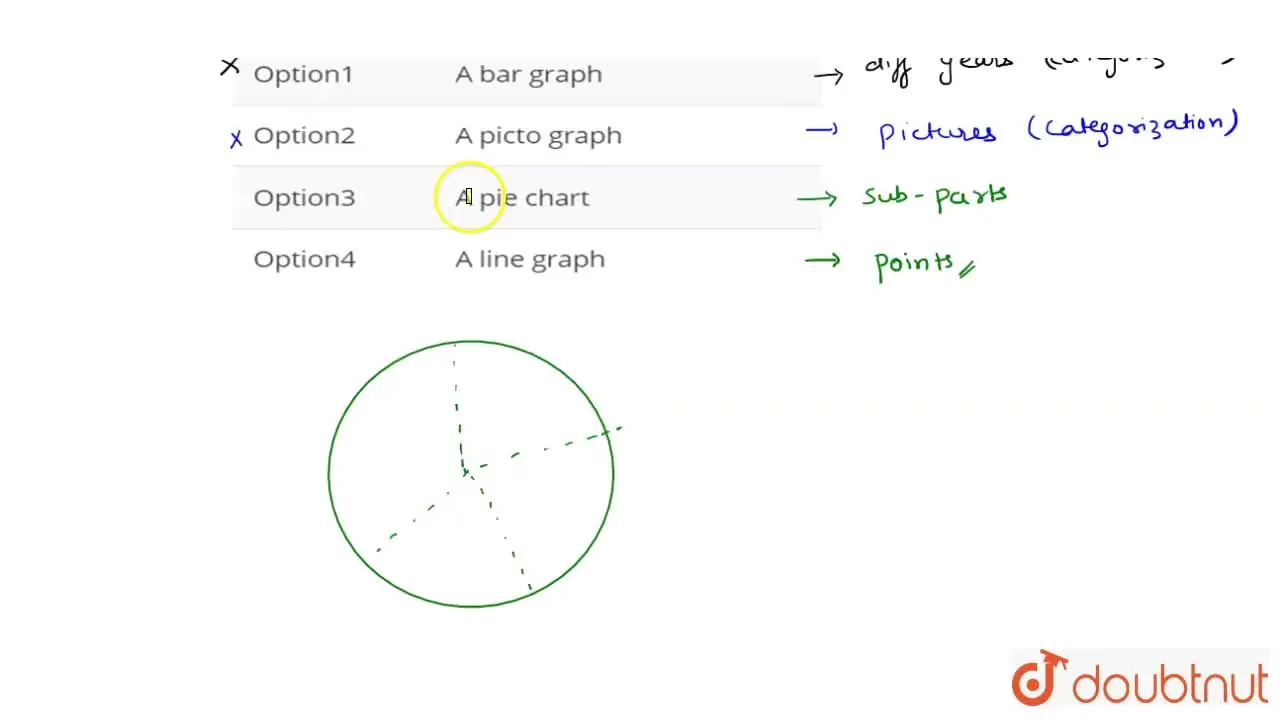
In statistics, a suitable graph for representing the partitioning of total into sub parts is
A bar graph
A picto graph
A pie chart
A line graph
The correct Answer is:C
Step by step video, text & image solution for In statistics, a suitable graph for representing the partitioning of total into sub parts is by Maths experts to help you in doubts & scoring excellent marks in Class 7 exams.
Related Playlists
- BOOK - S CHAND IIT JEE FOUNDATIONCHAPTER - DATA HANDLING EXERCISE - Question Bank - 24 (b)15videos
DATA HANDLING
- BOOK - S CHAND IIT JEE FOUNDATIONCHAPTER - DATA HANDLING EXERCISE - Self Assessment Sheet - 2410videos
DATA HANDLING
- BOOK - S CHAND IIT JEE FOUNDATIONCHAPTER - DATA HANDLING EXERCISE - Self Assessment Sheet - 2410videos
DATA HANDLING
- BOOK - S CHAND IIT JEE FOUNDATIONCHAPTER - CIRCUMFERENCE AND AREA OF A CIRCLE EXERCISE - SELF ASSESSMENT SHEET - 2210videos
CIRCUMFERENCE AND AREA OF A CIRCLE
- BOOK - S CHAND IIT JEE FOUNDATIONCHAPTER - DECIMALS EXERCISE - SELF ASSESSMENT SHEET10videos
DECIMALS
Similar Questions
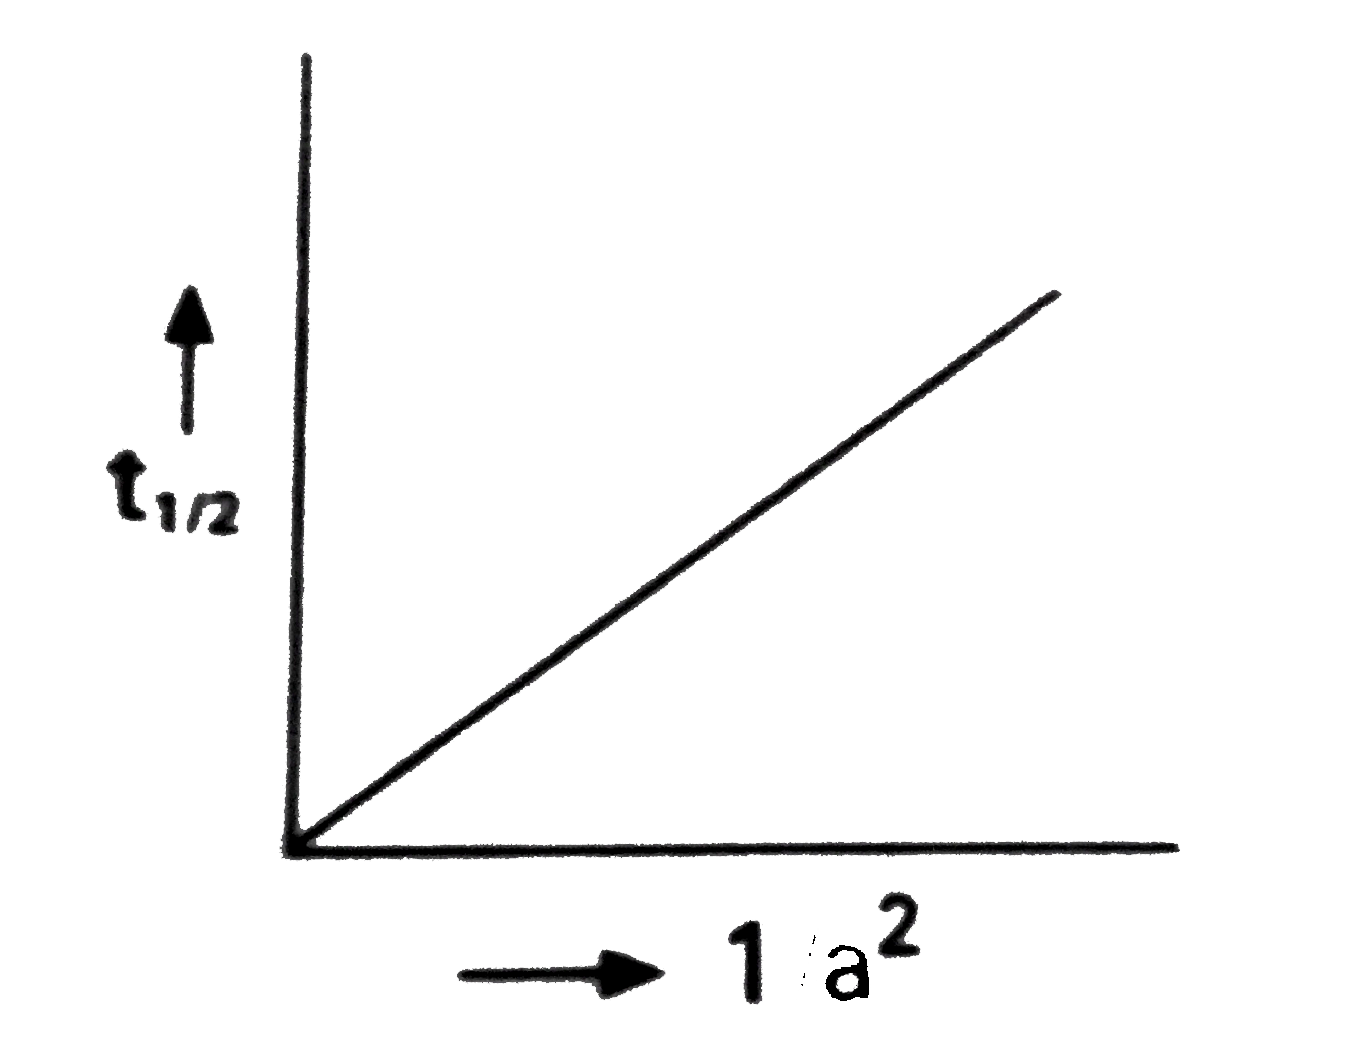
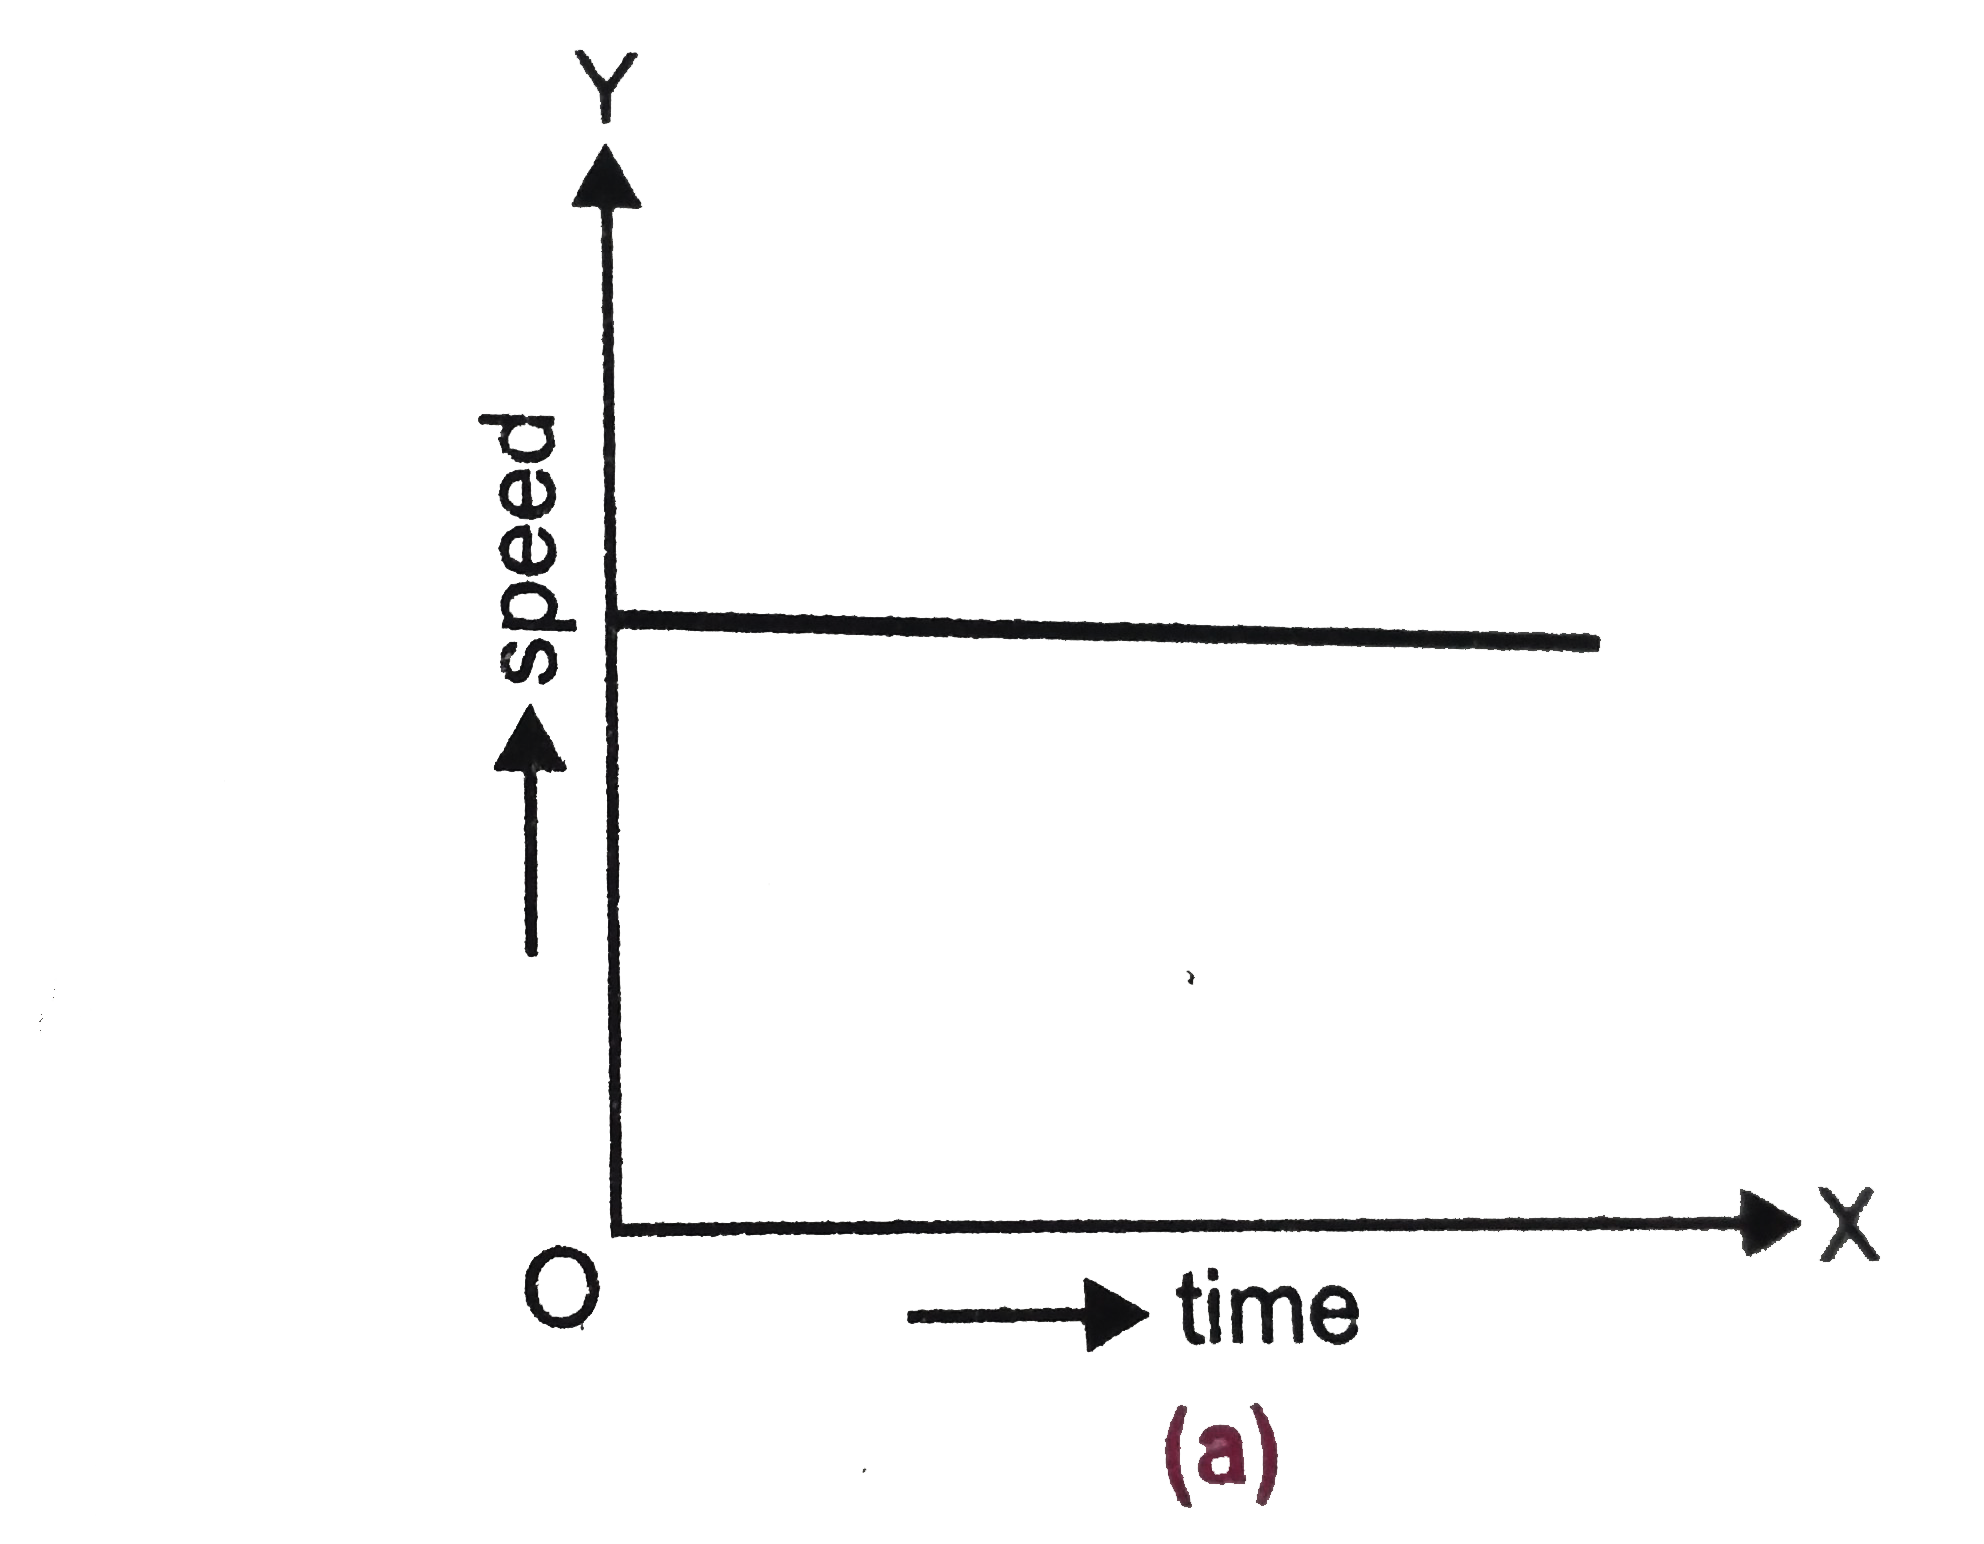
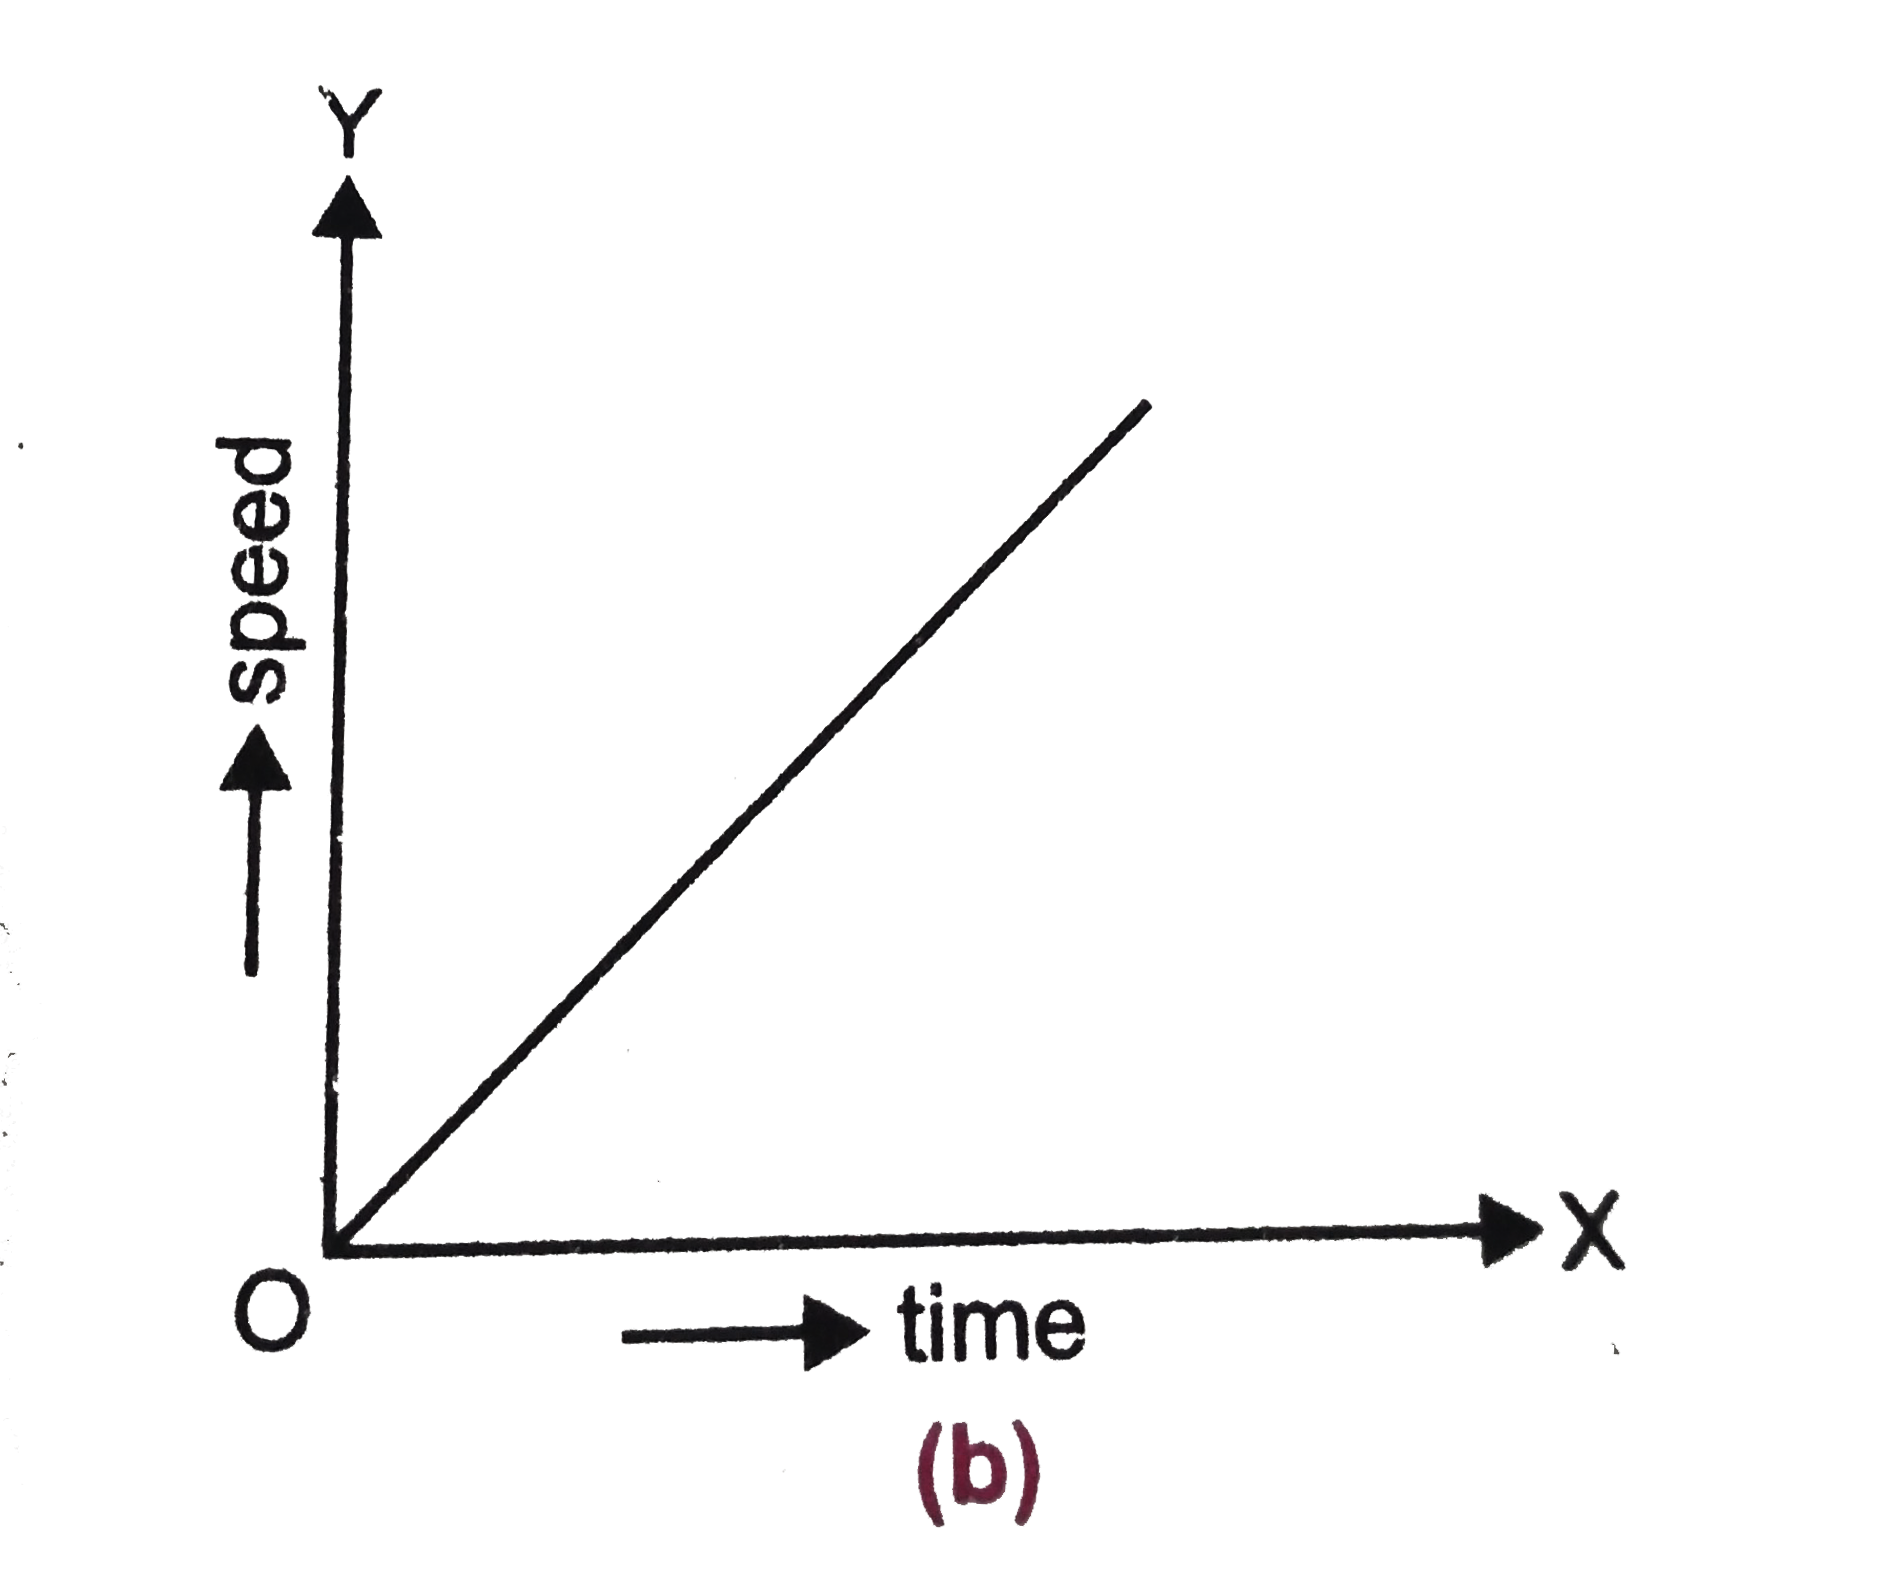
This graph represents:
 View Solution
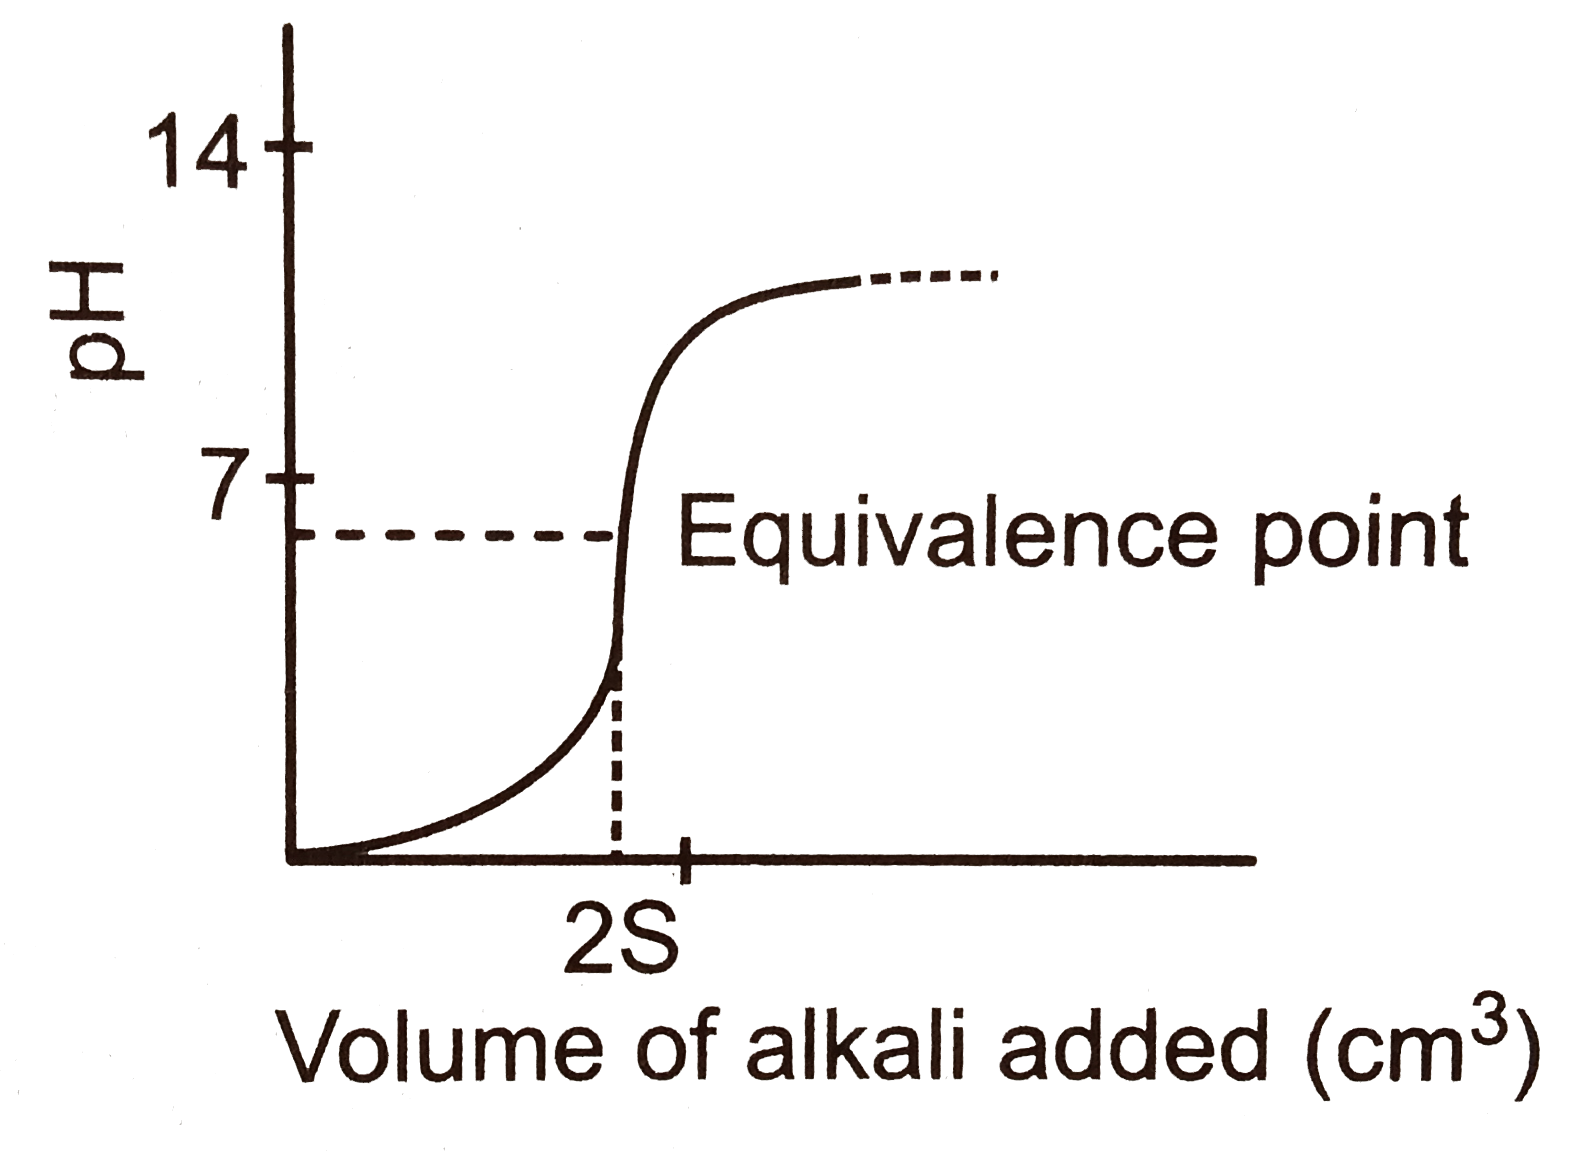
The graph represents the titration curve for :View SolutionThe following graph represents
 View Solution
In statistics, the bar graph of a frequency distribution is called
View SolutionIn statistics, the bar graph of a frequency distribution is called
View SolutionThe graph representing Boyle's law is (are):
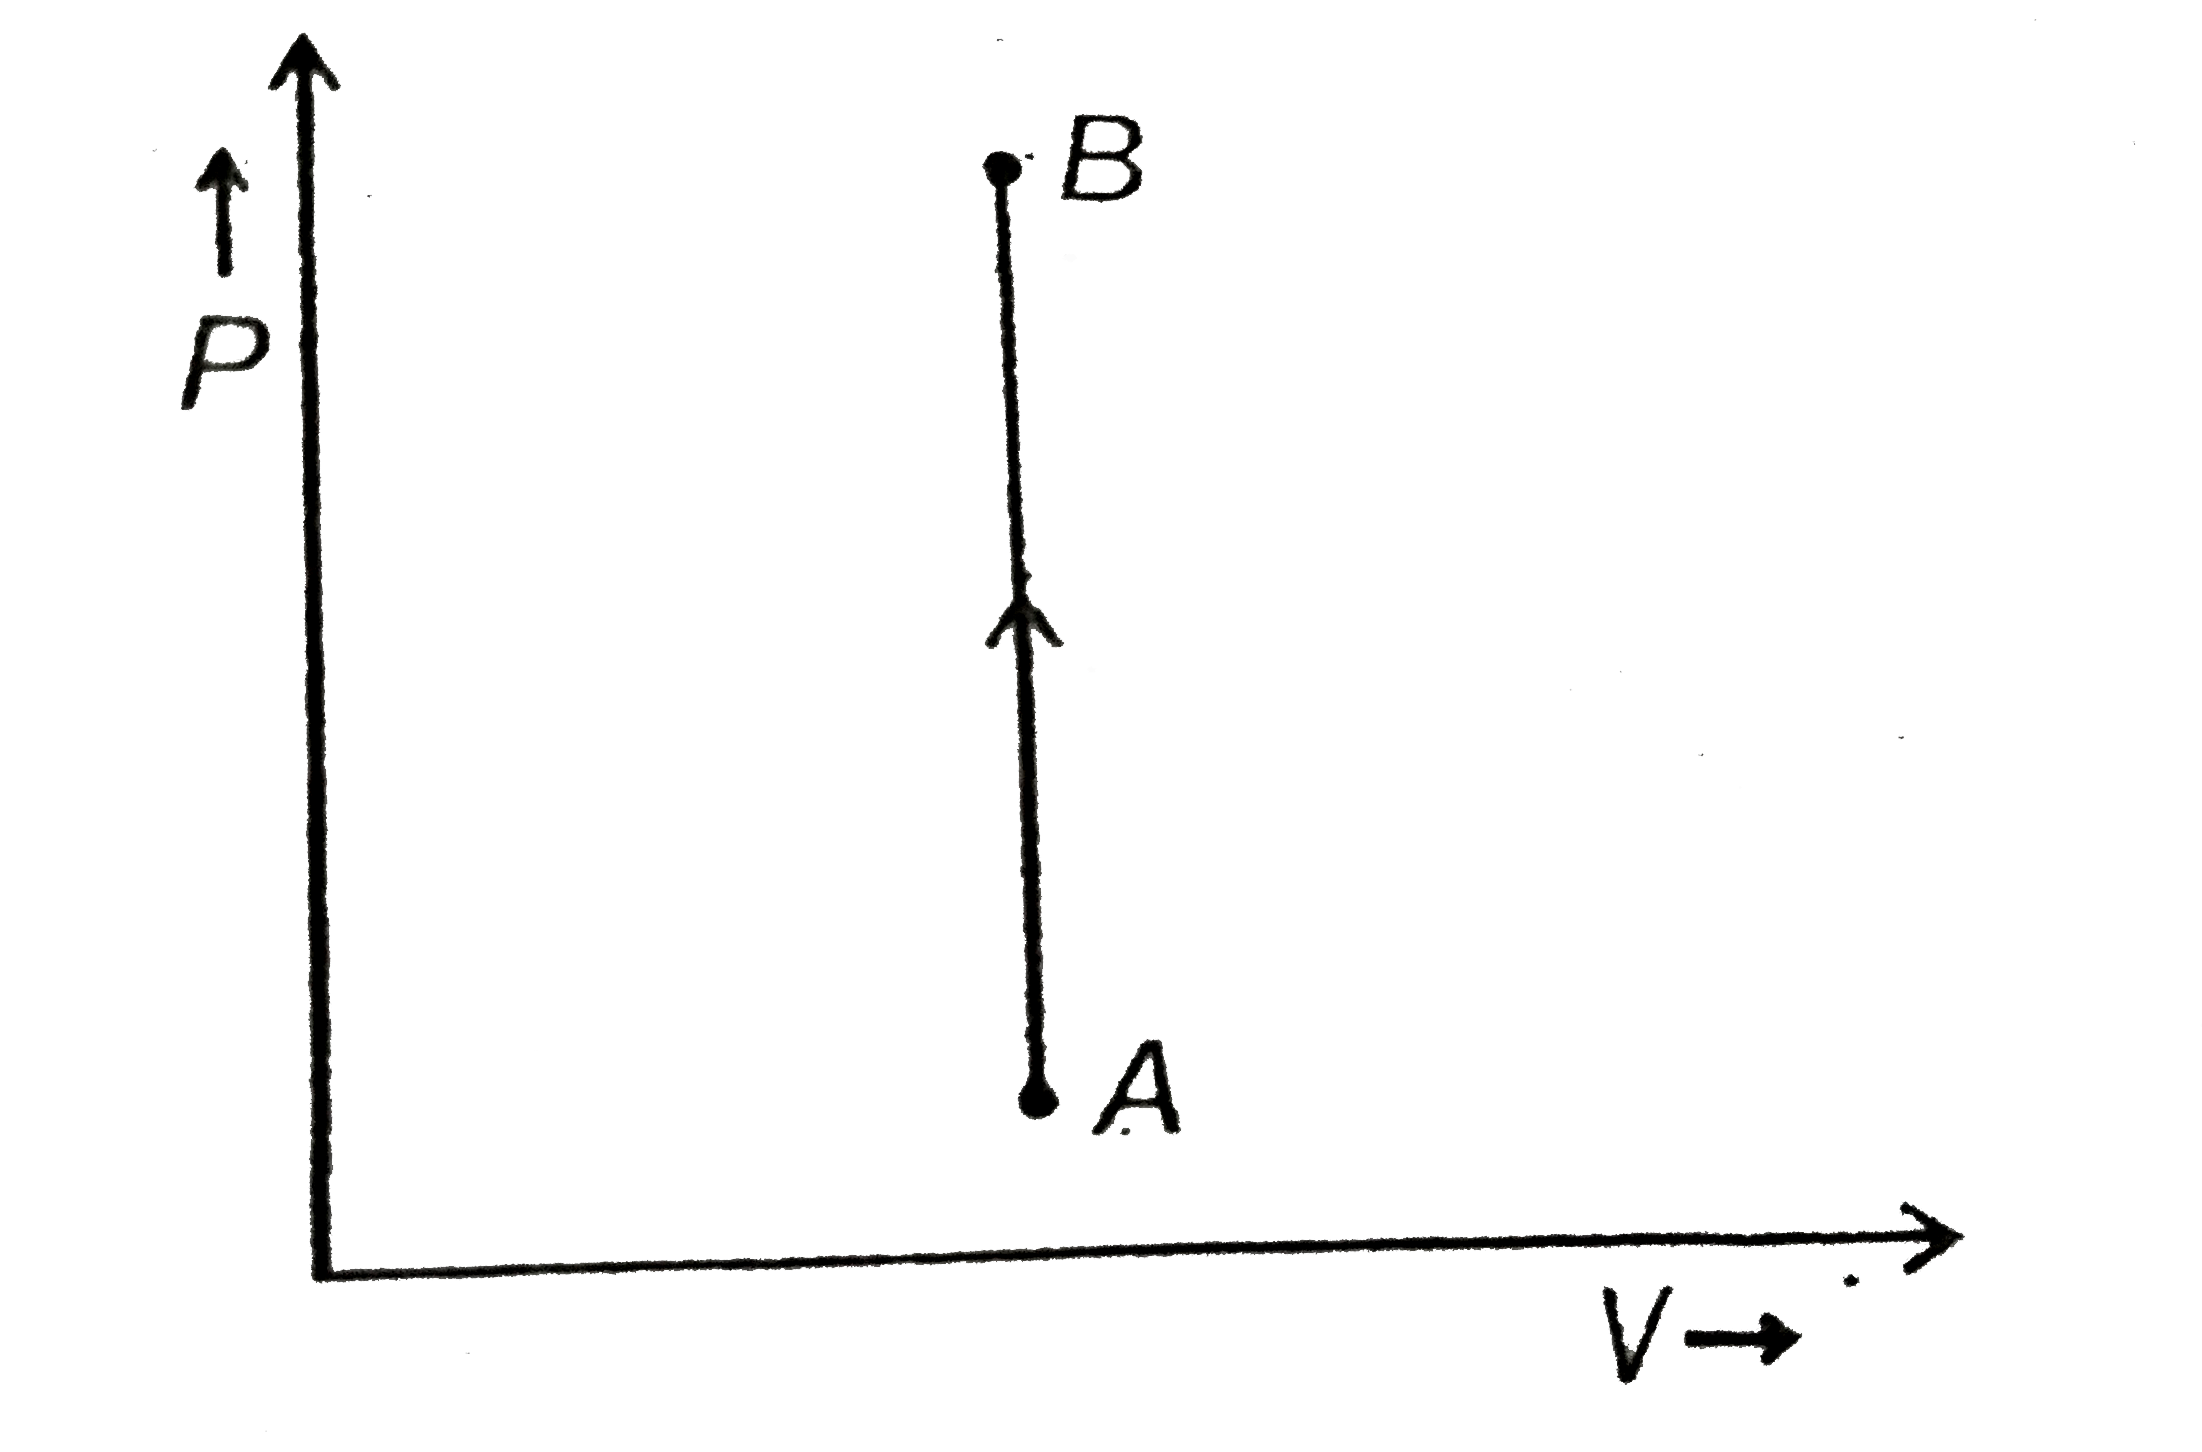
View SolutionWhat is represented by the graph in Figure ?
 View Solution
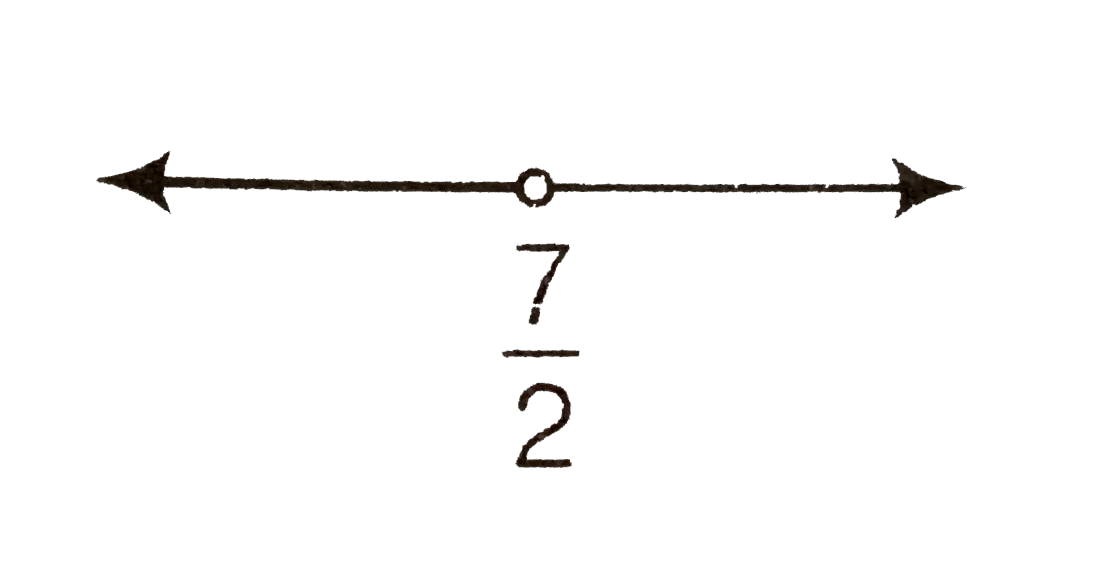
The inequality representing the following graph is
 View Solution
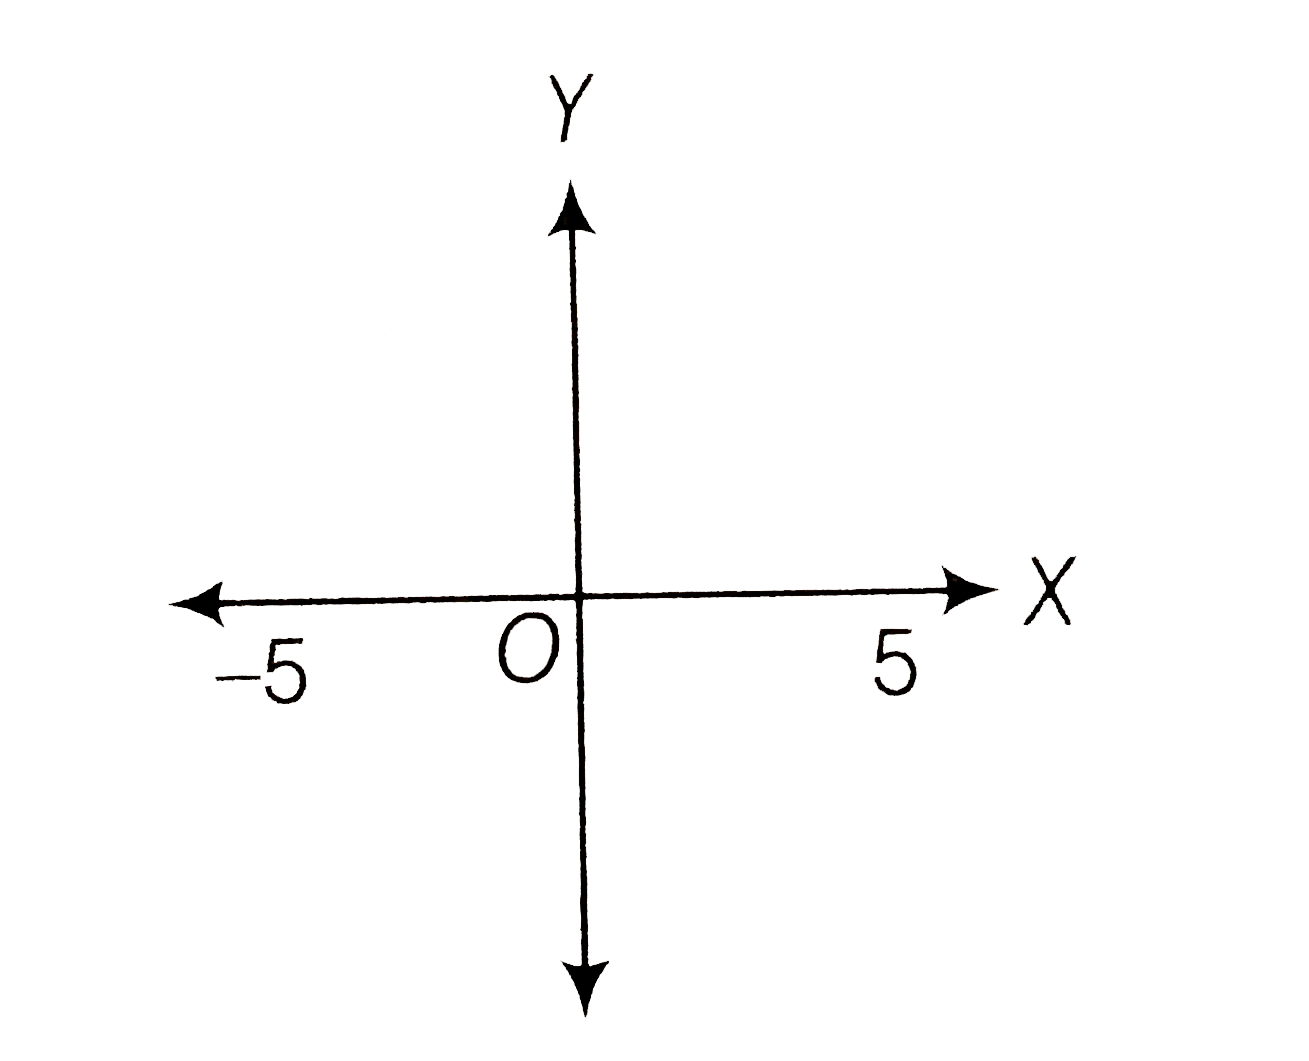
The inequality representing the following graph is
 View Solution
The inequality representing the following graph is
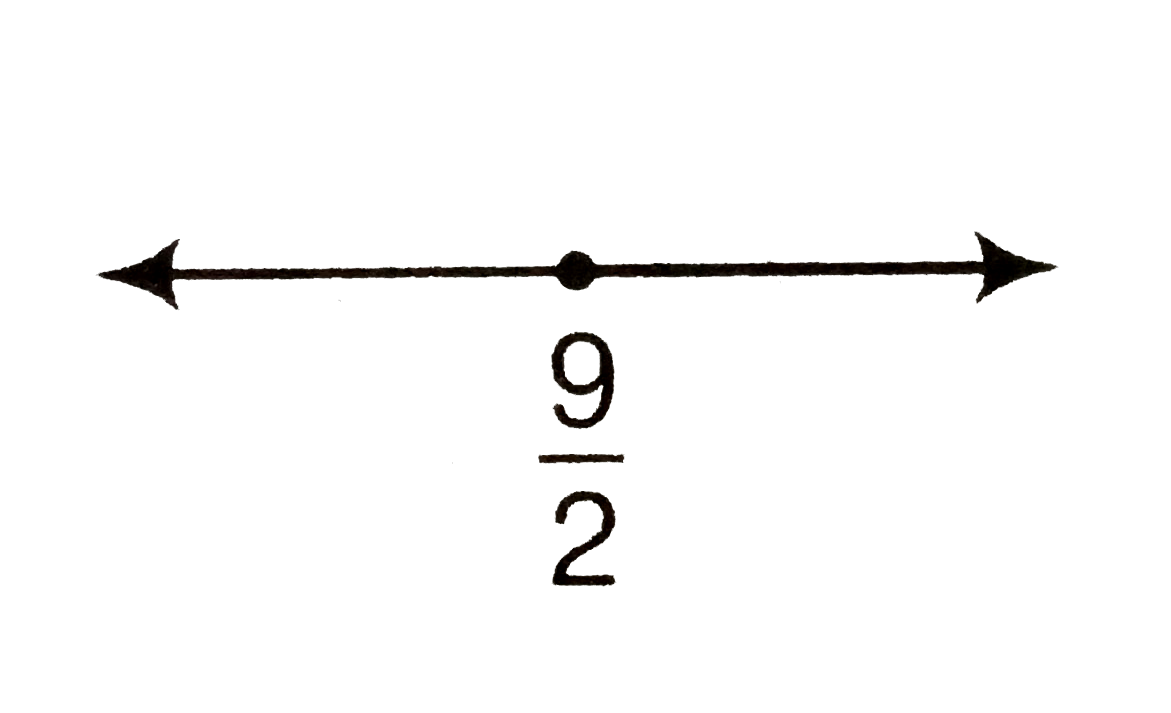 View Solution

