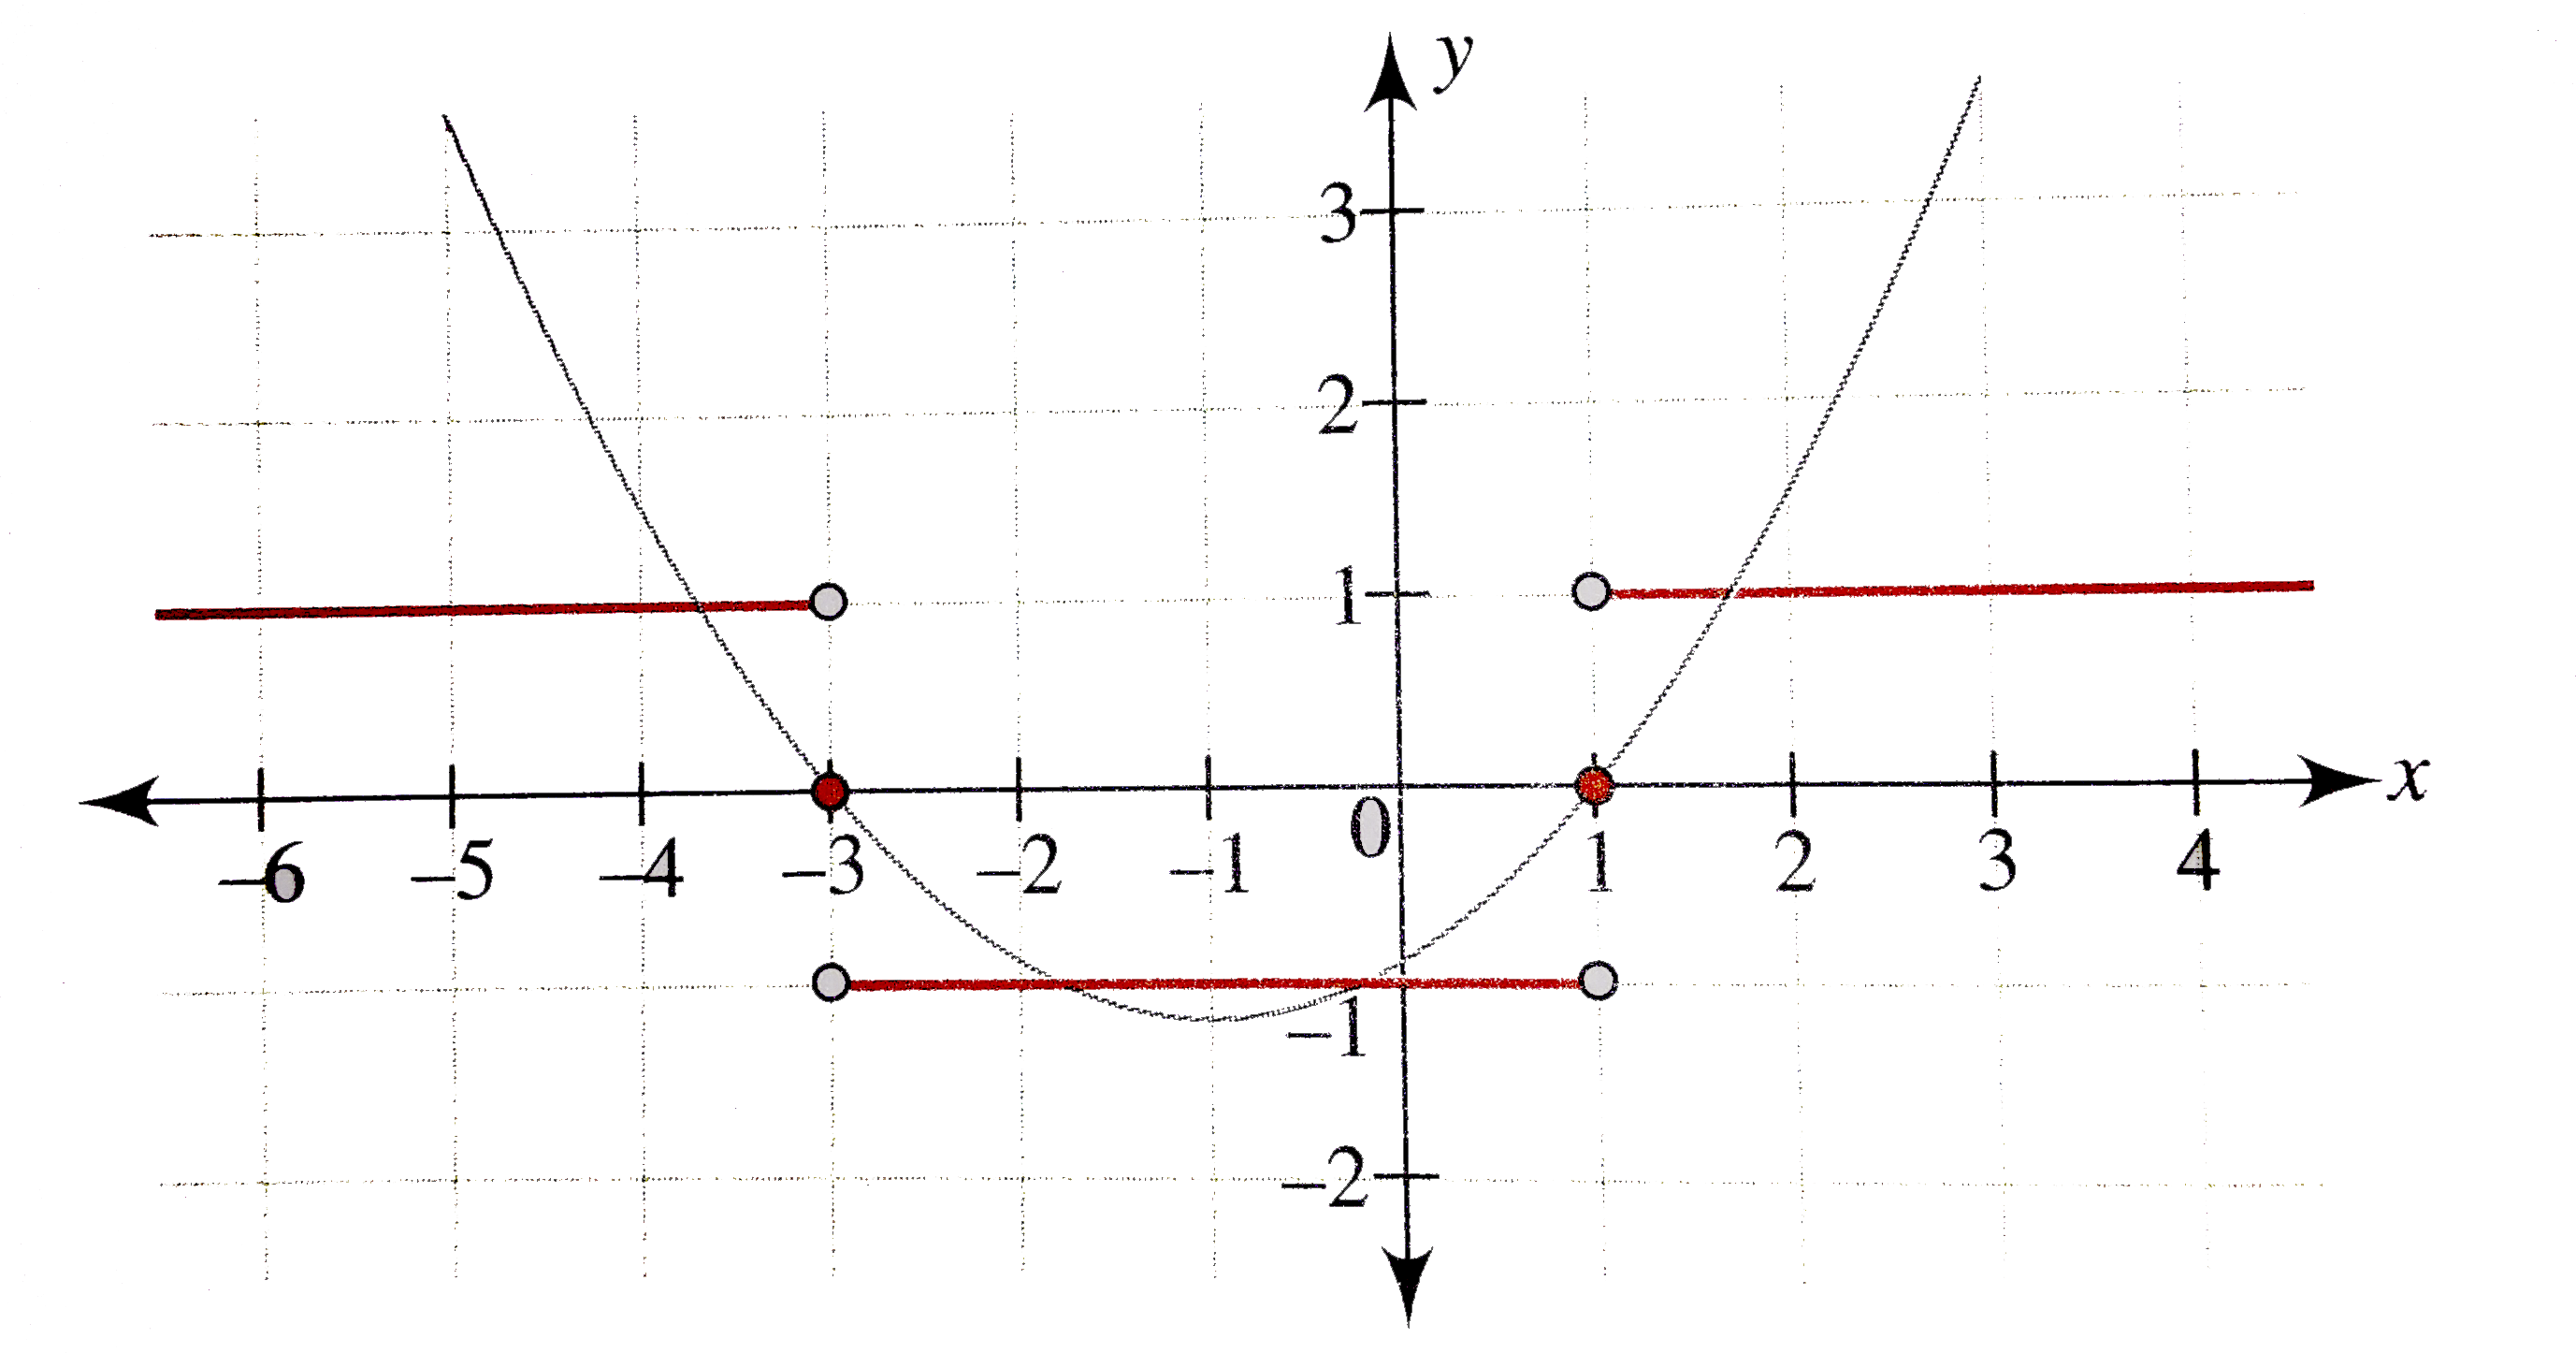
In the following graph, state the absolute and the local maximum and minimum values of the function.
 Solution in Bengali
From the graph, f(x)>0 for x<−3orx>1
∴ sgn(f(x))=1 for x∈(−∞,−3)∪(1,∞)
f(x)<0 for x∈(−3,1)
∴ sgn(f(x))=−1 for x∈(−3,1)
f(x)=0 for x=−3,1
∴ sgn(f(x))=0 for x=−3,1
Hence the graph of y=sgn(f(x)) is as shown in the following figure.

Topper's Solved these Questions
- GRAPHS OF ELEMENTARY FUNCTIONS BOOK - CENGAGE PUBLICATIONCHAPTER - GRAPHS OF ELEMENTARY FUNCTIONS EXERCISE - EXERCISES
34 Videos
- GRAPHS OF POLYNOMIAL AND RATIONAL FUNCTIONSBOOK - CENGAGE PUBLICATIONCHAPTER - GRAPHS OF POLYNOMIAL AND RATIONAL FUNCTIONSEXERCISE - Exercises
17 Videos
- GRAPHS OF TRIGONOMETRIC FUNCTIONSBOOK - CENGAGE PUBLICATIONCHAPTER - GRAPHS OF TRIGONOMETRIC FUNCTIONSEXERCISE - Exercises
22 Videos
Similar Questions
Draw the graph of y=1(1/x).
View SolutionDraw the graph of y=(x−1)(x2−x+1).
View SolutionDraw the graph of y= cosec 2x−cot2x. Is f(x) periodic ? If yes, what is its fundamental period ?
View SolutionIn the following graph, state the absolute and local maximum and minimum values of the function.
(##CEN_GRA_C01_S01_022_Q01.png" width="80%">
View SolutionWhich of the following are correct chain isomers of butane ? (i)
View SolutionDetermine the point of symmetry of a regular hexagon.
View SolutionDtermine the images of the following figure about the given line :
View SolutionMatch the following Column A to Column B

View SolutionMatch the following Column A to Column B

View SolutionMatch the following Column A to Column B

View SolutionThe inequation represented by the graph given below is :
View SolutionThe inequation that best describes the graph given below is _________
View SolutionThe inequation that best describes the following graph is _________
View SolutionWhich inequations represent the shaded region in the given figure
View SolutionIn Fig, find the value of x.
ltimg src="https://d10lpgp6xz60nq.cloudfront.net/physics_images/PS_MATH_IX_C12_S01_032_Q01.png" width="80%"gt
View SolutionAt x=0, value of (dy)/(dx) is : ltimg src="https://d10lpgp6xz60nq.cloudfront.net/physics_images/ALN_PHY_R04_E01_024_Q01.png" width="80%"gt
View Solution
