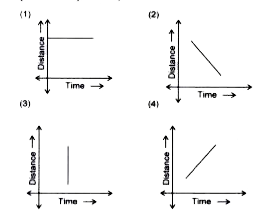
Which of the following distance-time graphs shows a truck moving with speed which is not constant?
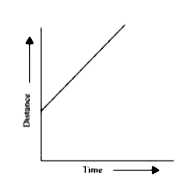
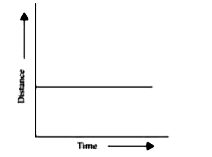
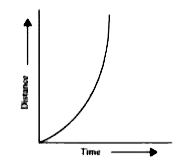
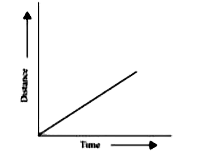
The correct Answer is:C
To determine which distance-time graph shows a truck moving with a speed that is not constant, we can follow these steps:
1. Understand Speed and Distance-Time Graphs:
- Speed is defined as the distance traveled per unit of time. Mathematically, it is expressed as:
Speed=DistanceTime
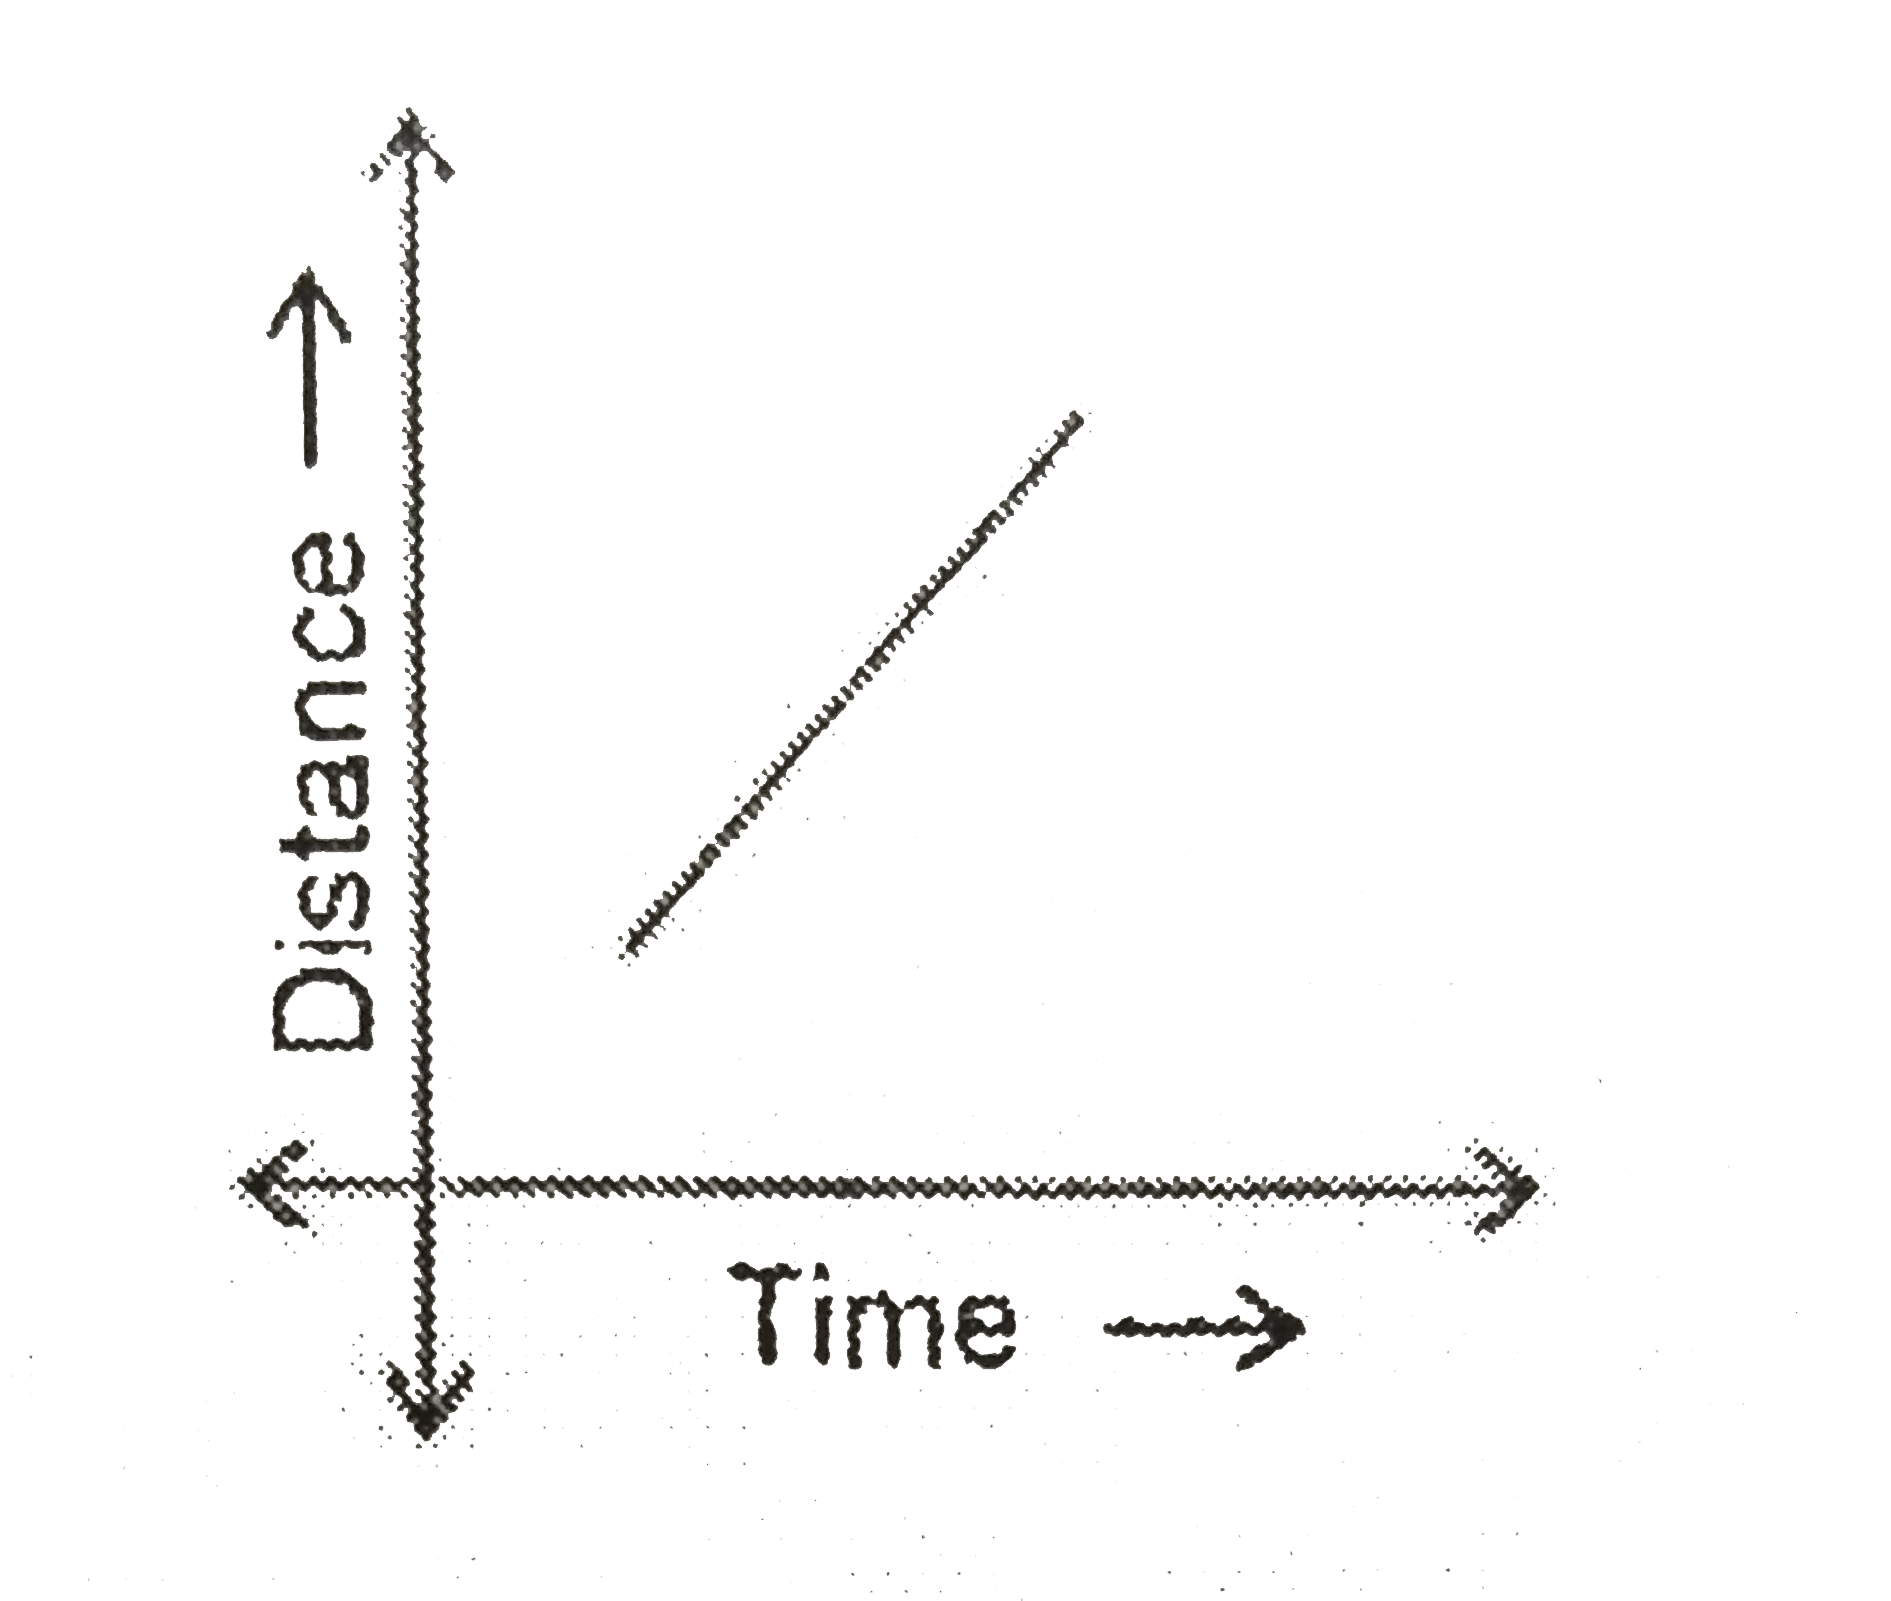
- In a distance-time graph, if the speed is constant, the graph will be a straight line. This is because distance increases proportionally with time.
2. Identify Characteristics of Constant Speed:
- If the speed is constant, the graph will show a straight line. This indicates that for every unit of time, the distance increases by a fixed amount.
3. Identify Characteristics of Non-Constant Speed:
- If the speed is not constant, the graph will not be a straight line. Instead, it may curve or change slope, indicating that the distance is not increasing uniformly with time.
4. Analyze the Given Options:
- Option 1: Straight line graph - indicates constant speed.
- Option 2: Straight line graph - indicates constant speed.
- Option 3: Parabolic graph - indicates changing speed (not constant).
- Option 4: Straight line graph - indicates constant speed.
5. Select the Correct Answer:
- From the analysis, options 1, 2, and 4 represent constant speed (straight lines). Only option 3, which is a parabolic graph, indicates that the speed is not constant. Therefore, the correct answer is:
Option 3
Summary of the Solution:
The distance-time graph that shows a truck moving with speed that is not constant is represented by a parabolic graph, which corresponds to option 3.
- Speed is defined as the distance traveled per unit of time. Mathematically, it is expressed as:
Speed=DistanceTime
- In a distance-time graph, if the speed is constant, the graph will be a straight line. This is because distance increases proportionally with time.
- If the speed is constant, the graph will show a straight line. This indicates that for every unit of time, the distance increases by a fixed amount.
- If the speed is not constant, the graph will not be a straight line. Instead, it may curve or change slope, indicating that the distance is not increasing uniformly with time.
- Option 1: Straight line graph - indicates constant speed.
- Option 2: Straight line graph - indicates constant speed.
- Option 3: Parabolic graph - indicates changing speed (not constant).
- Option 4: Straight line graph - indicates constant speed.
- From the analysis, options 1, 2, and 4 represent constant speed (straight lines). Only option 3, which is a parabolic graph, indicates that the speed is not constant. Therefore, the correct answer is:
Option 3
The distance-time graph that shows a truck moving with speed that is not constant is represented by a parabolic graph, which corresponds to option 3.
Topper's Solved these Questions
Similar Questions
Knowledge Check
Which of the following distance time graphs shows a truck moving with a speed which is not constant ?
A B
B C
C D
D
Which of the following distance-time graphs is not possible?
A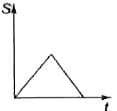 B
B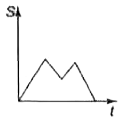 C
C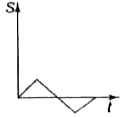 D
D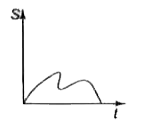
Which of the following distance time graphs is possible ?
A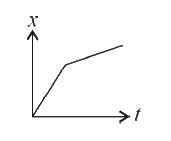 B
B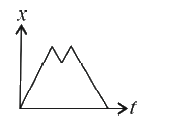 C
C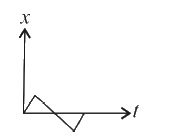 D
D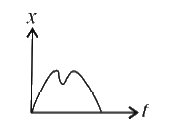
Draw a distance-time graph to show the motion of a car moving with a speed which is not constant (non-uniform speed).
View SolutionWhich of the following x - t graphs shows an object moving with negative acceleration?

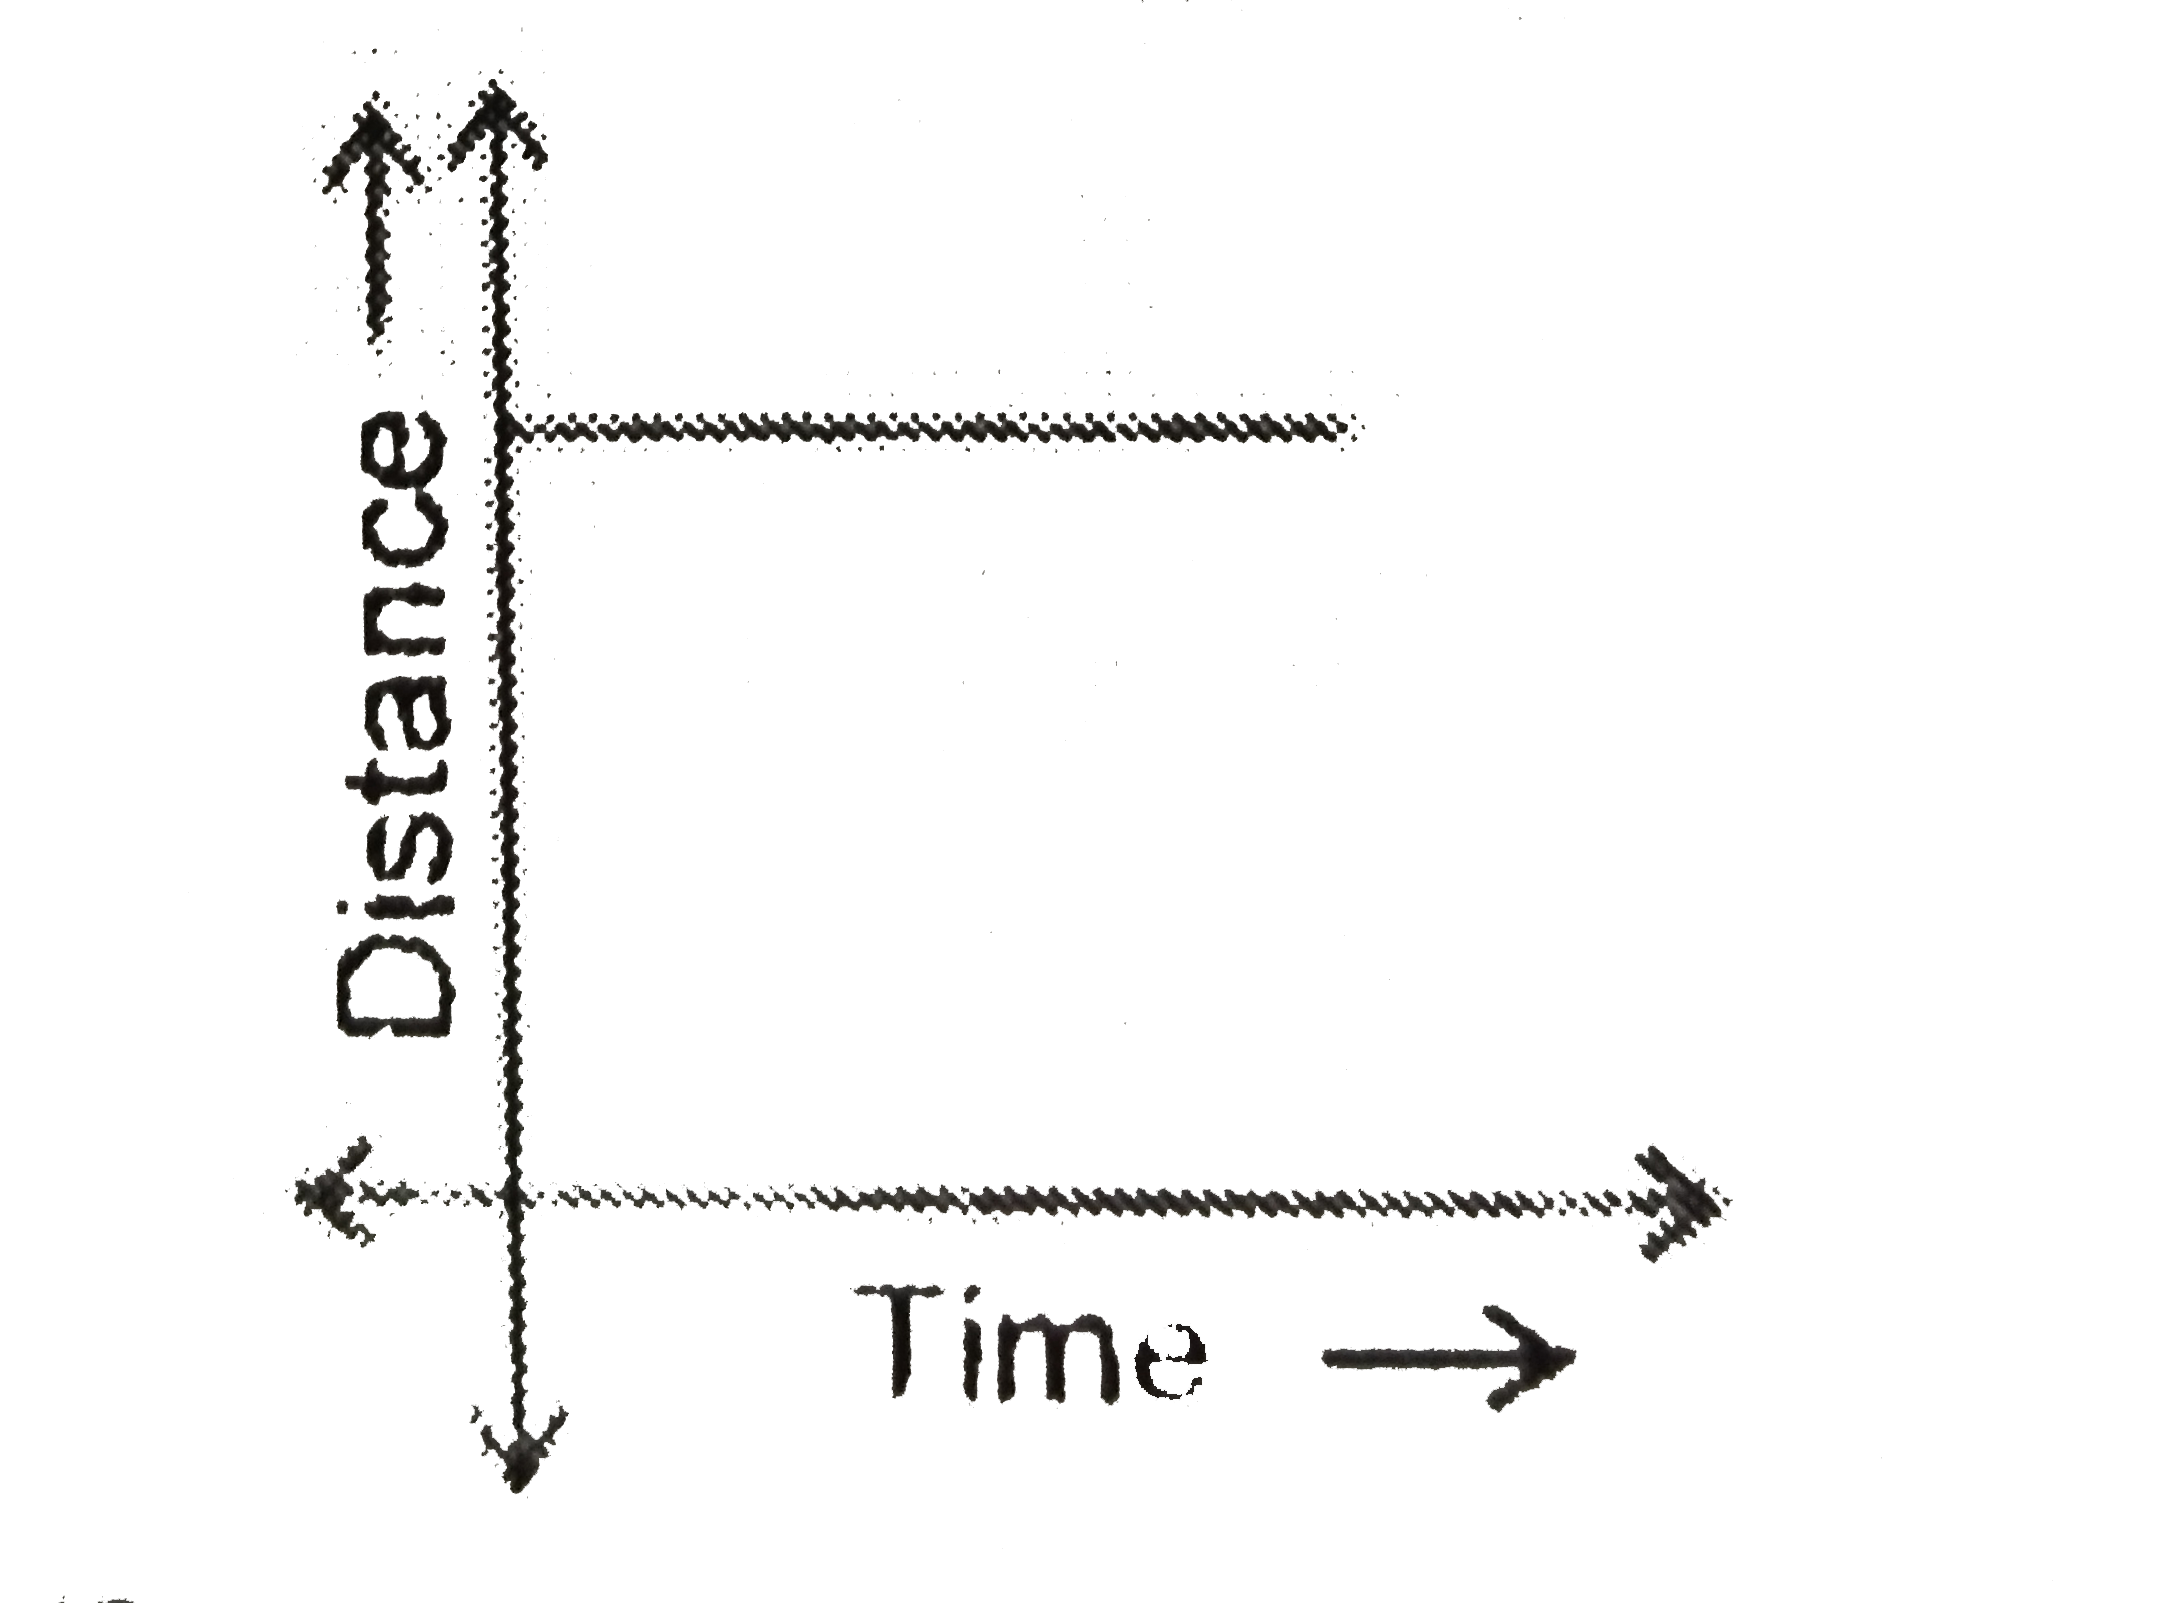
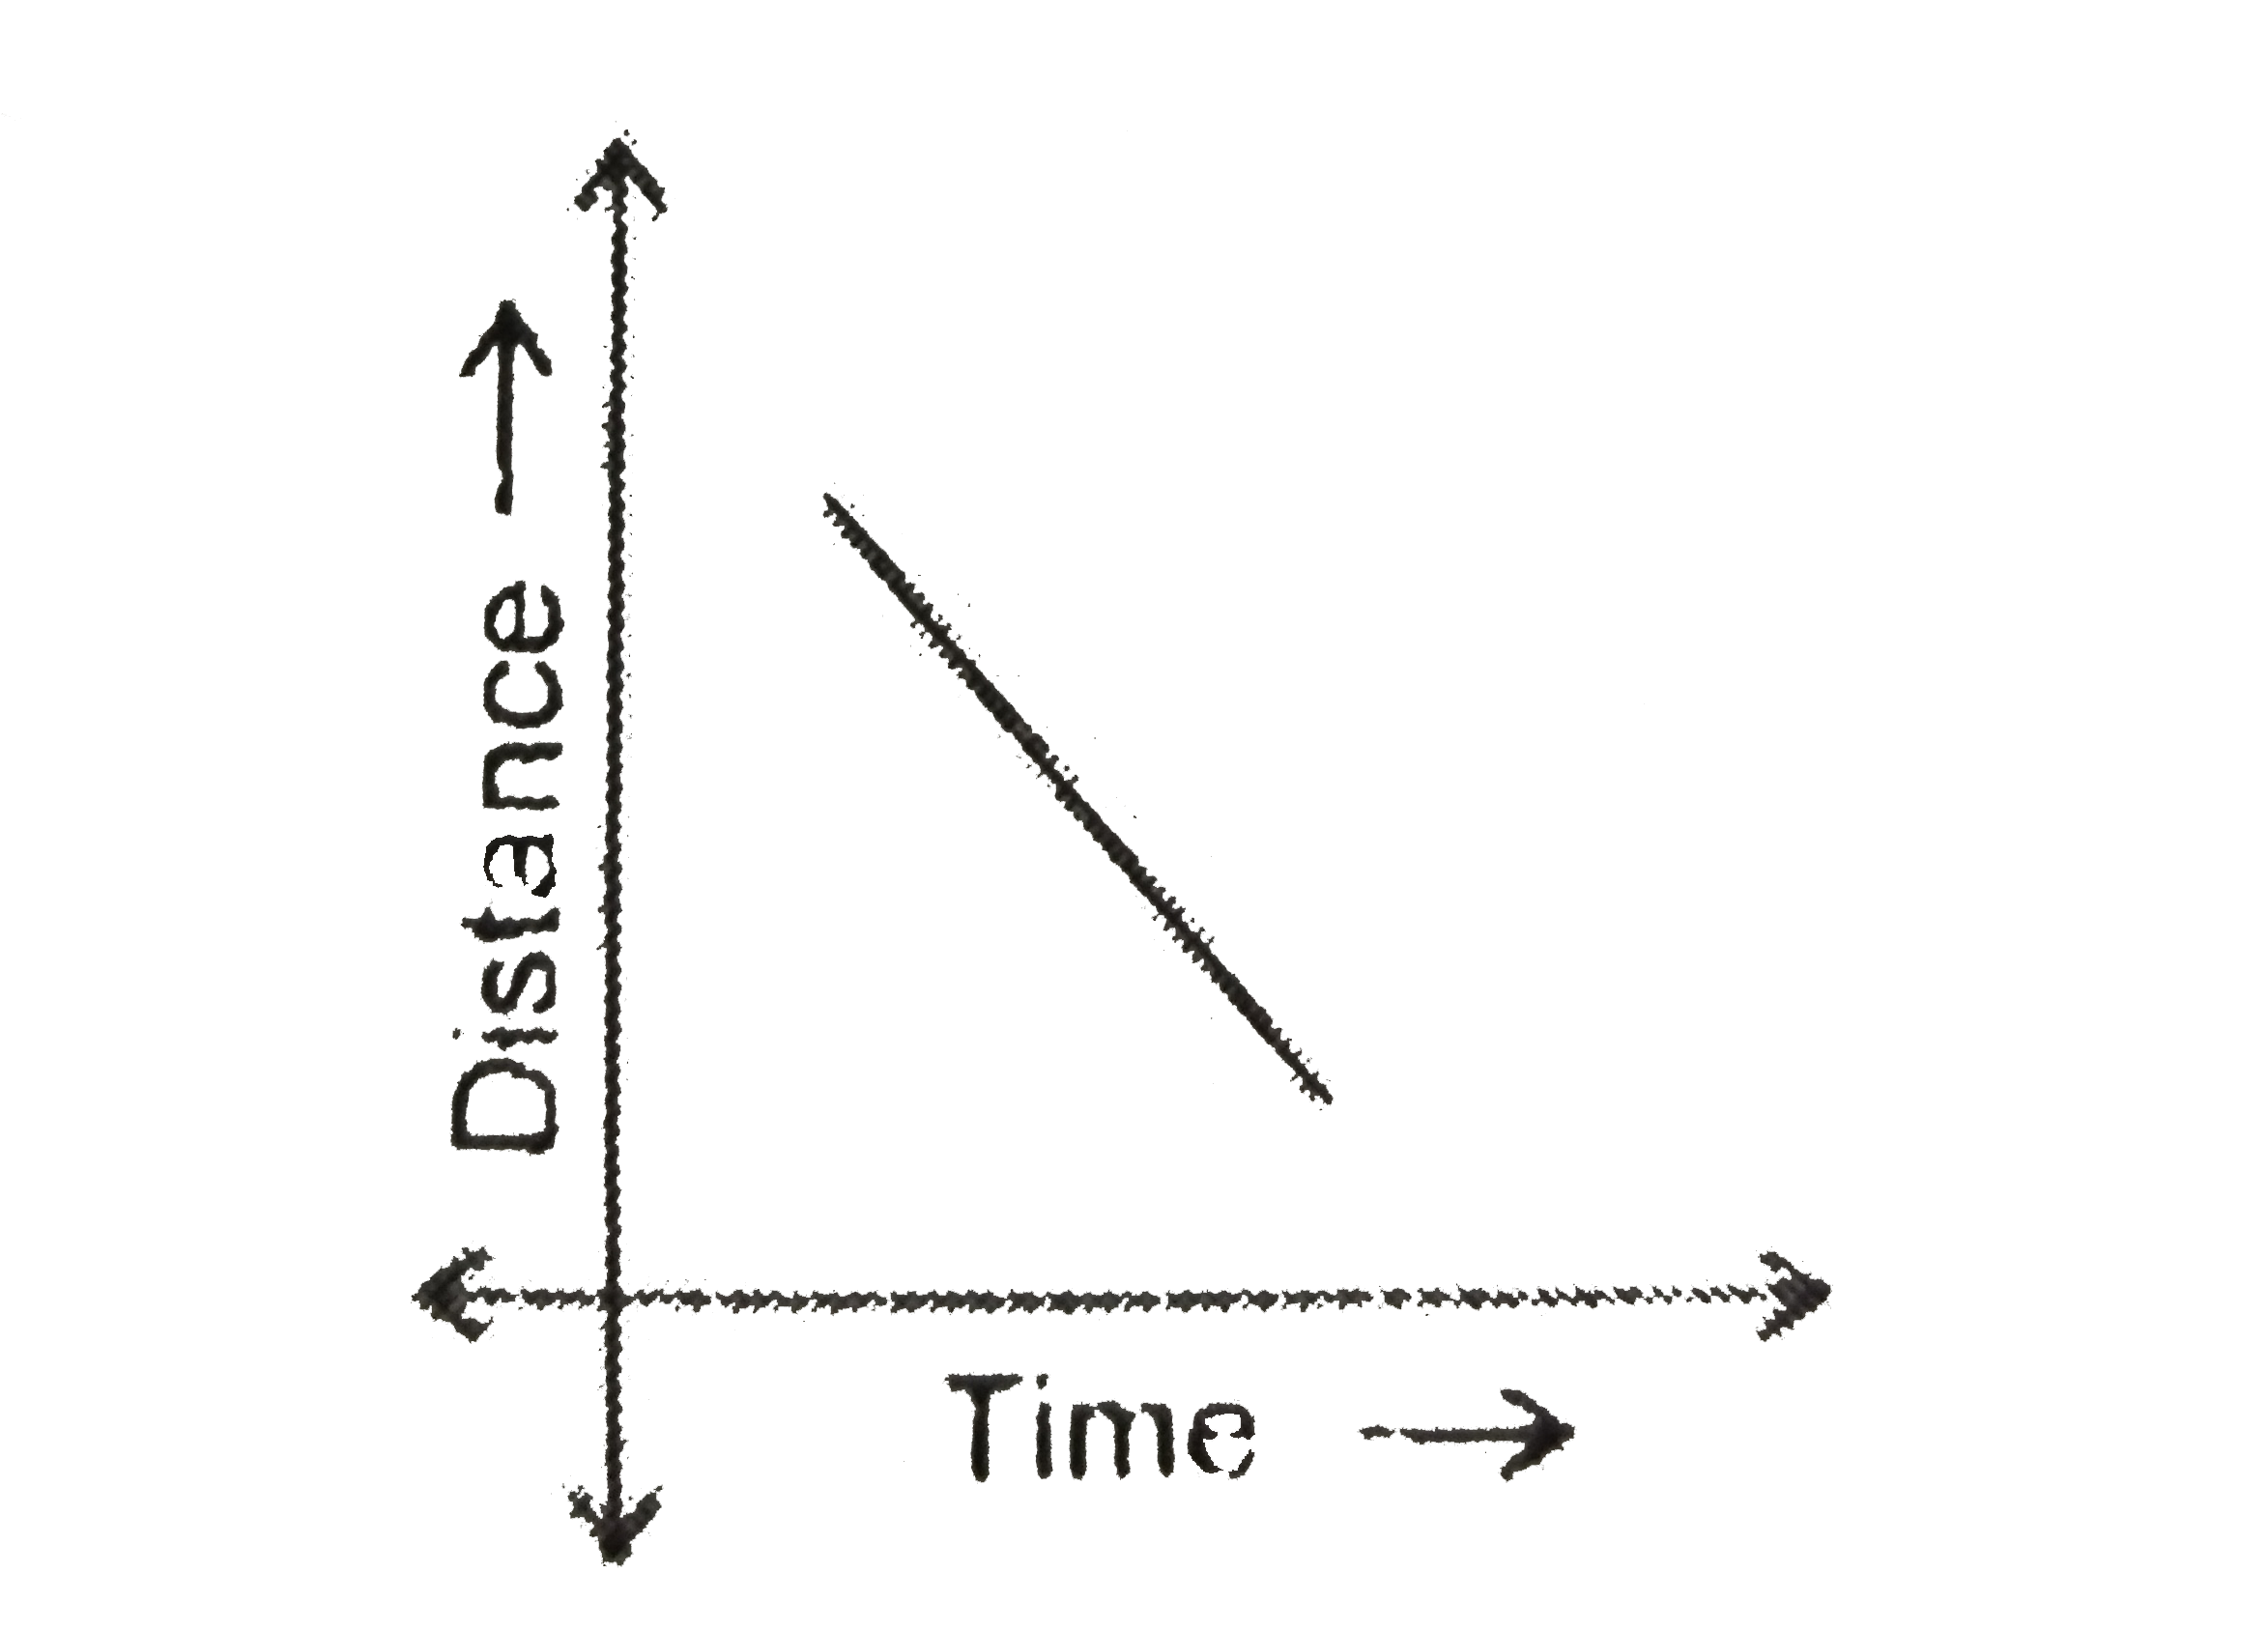
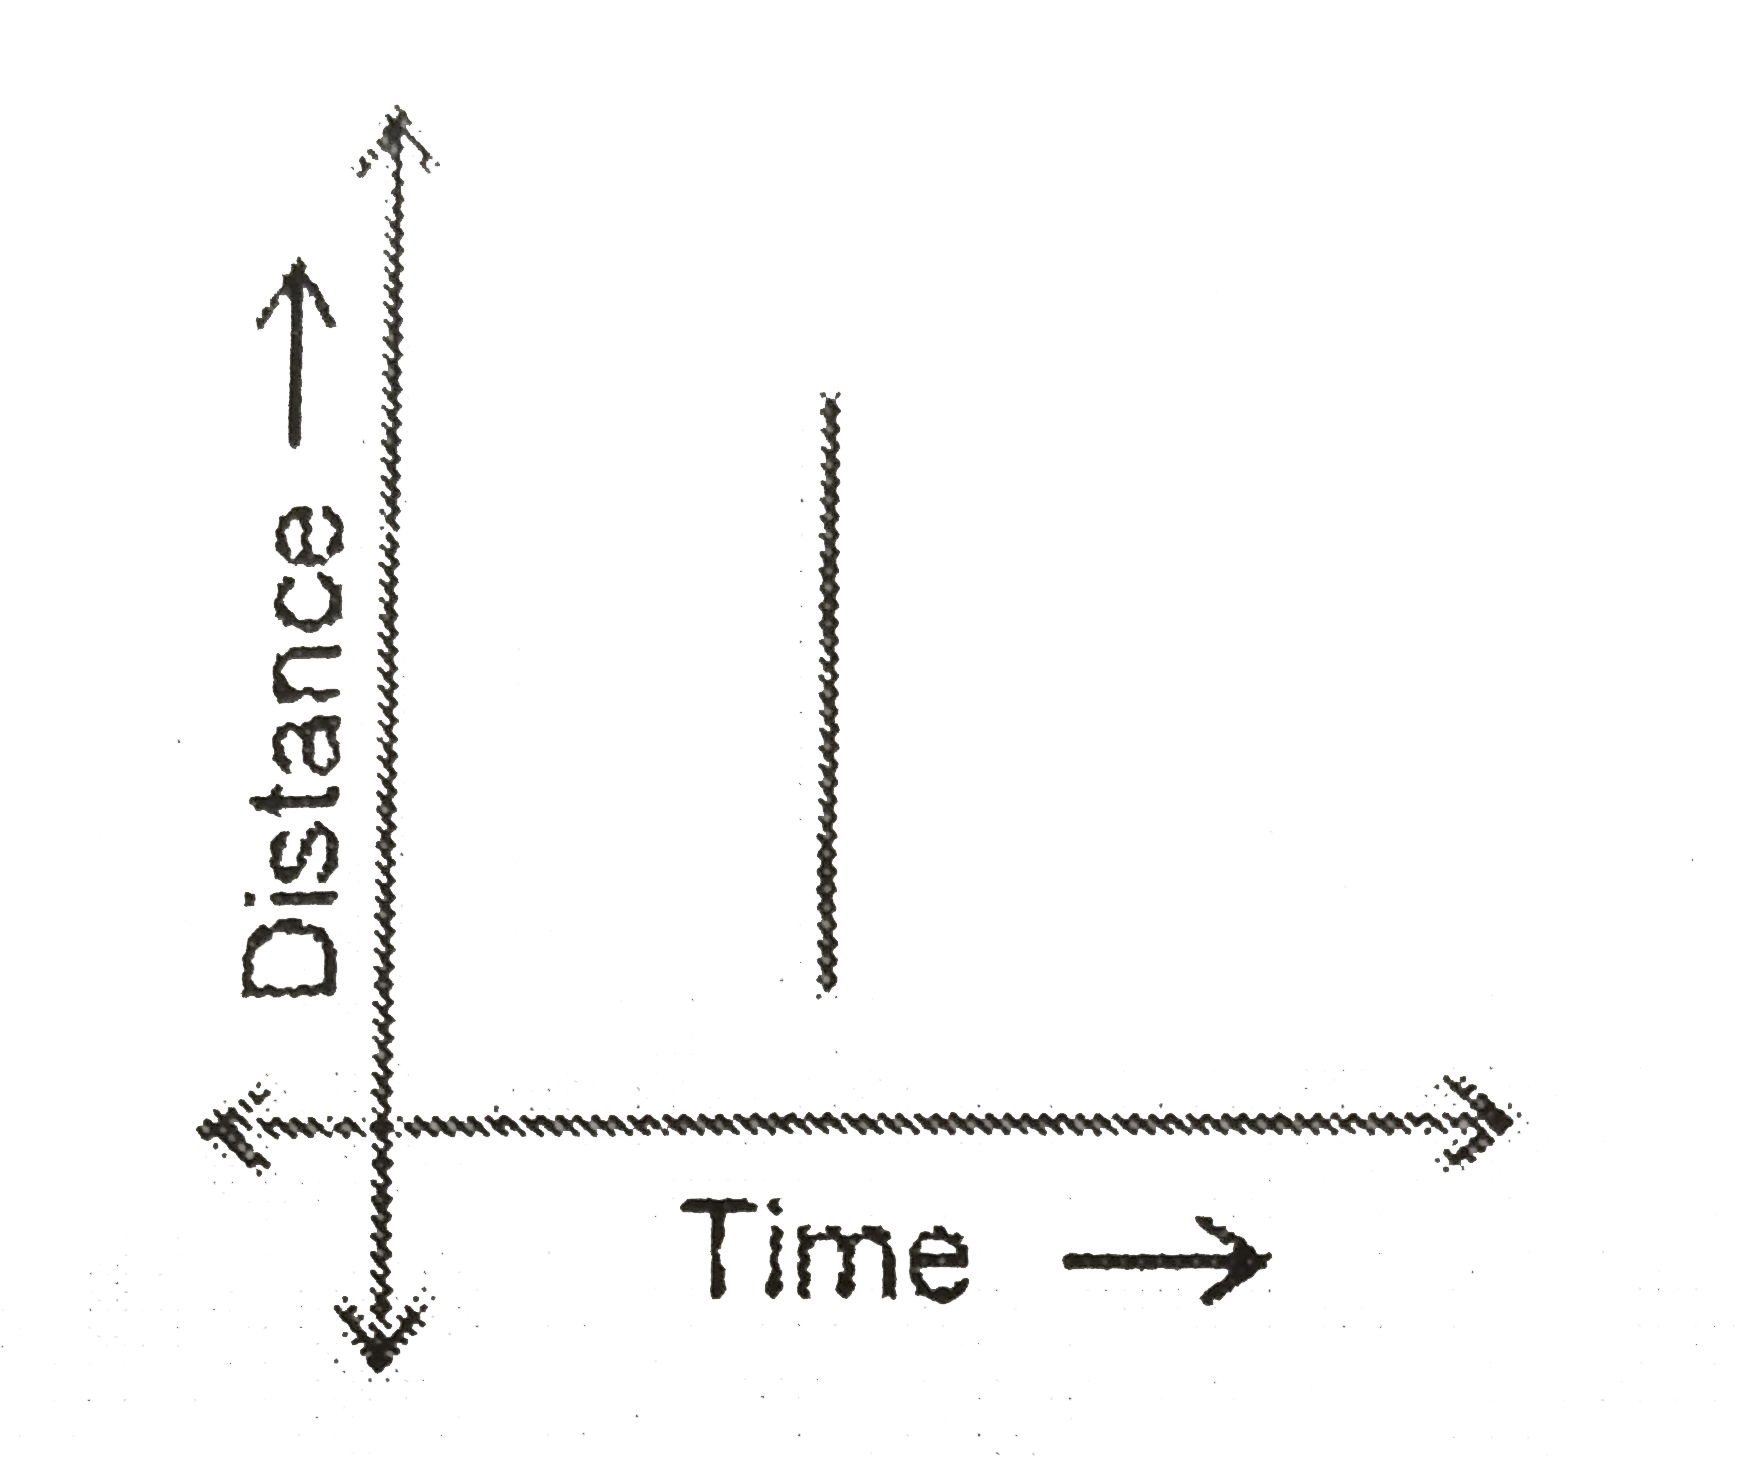
View SolutionWhich of the following distance - time graph is not possbile ? Explain why?
View SolutionWhich of the following speed-time graphs is not possible:
View SolutionWhich of the following distance-time graphs is not possible?
View Solution


