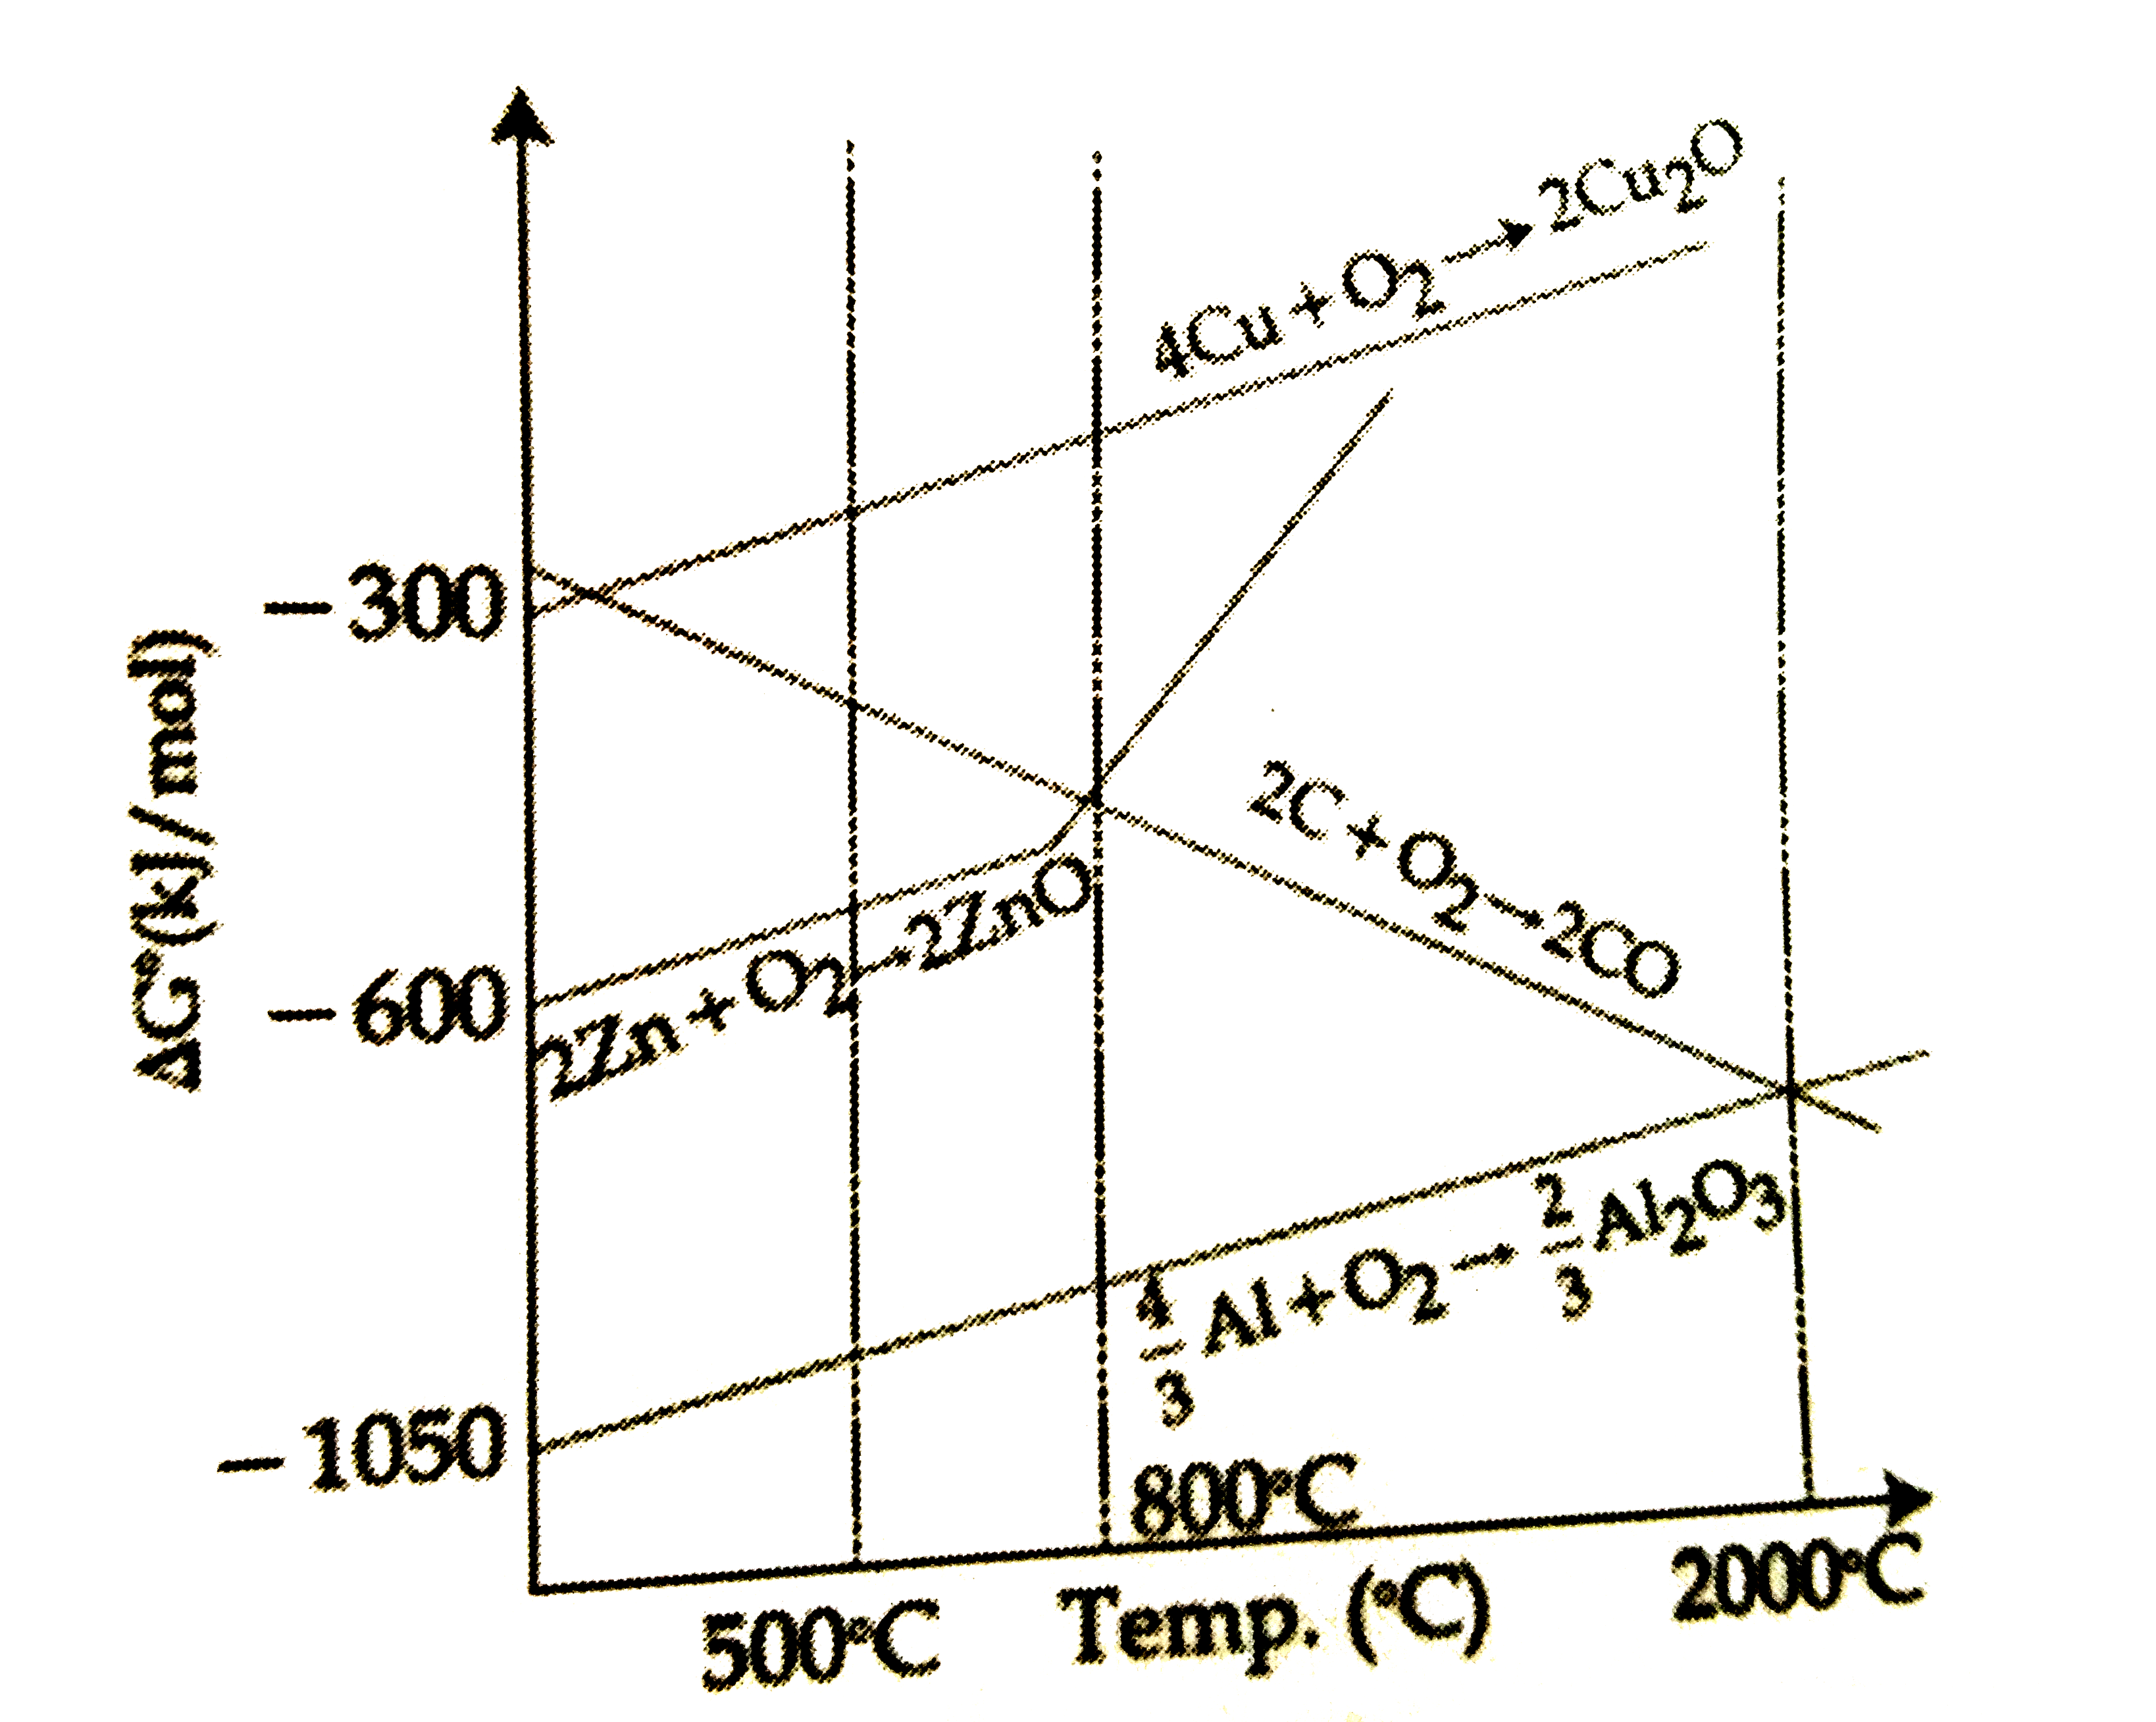
What is Ellingham diagram?
Video Solution
Text Solution
Plot of ΔGƟ vs T for the formation of oxides or various metals is known as Ellingham diagram.
|
Topper's Solved these Questions
- GENERAL PRINCIPLES AND PROCESSES OF ISOLATION OF ELEMENTS Book:ICSEChapter:GENERAL PRINCIPLES AND PROCESSES OF ISOLATION OF ELEMENTS Exercise:EXERCISE (PART-II ( DESCRIPTIVE QUESTIONS )) (SHORT ANSWER QUESTIONS)
Explore 205 Videos
- GENERAL PRINCIPLES AND PROCESSES OF ISOLATION OF ELEMENTS Book:ICSEChapter:GENERAL PRINCIPLES AND PROCESSES OF ISOLATION OF ELEMENTS Exercise:EXERCISE (PART-II ( DESCRIPTIVE QUESTIONS )) (LONG ANSWER QUESTIONS)
Explore 53 Videos
- GENERAL PRINCIPLES AND PROCESSES OF ISOLATION OF ELEMENTS Book:ICSEChapter:GENERAL PRINCIPLES AND PROCESSES OF ISOLATION OF ELEMENTS Exercise:EXERCISE (PART-I ( OBJECTIVE QUESTIONS )) (MATCH THE FOLLOWING)
Explore 6 Videos
- ELECTROCHEMISTRYBook:ICSEChapter:ELECTROCHEMISTRYExercise:ISC EXAMINATION QUESTIONS (PART-II Numerical Problems)
Explore 19 Videos
- HALOALKANES AND HALOARENES Book:ICSEChapter:HALOALKANES AND HALOARENES Exercise:SOURCE
Explore 9 Videos
Similar Questions
Knowledge Check
Which of the following is not correct observation on Ellingham diagram ?
AA metal can reduce the oxide of other metal which lies below it in Ellingham diagram .BCO is more effective than C as a reducing agent below 710∘CCΔG∘ of metal oxides is higher than that of CO2 hence oxidation of metal suphides to oxides is not favourable.DNeed for conversion of metal sulphide to metal oxide before reduction can be explained thermodynamically.
At temperature above 1073K coke can be used to reduce FeO to Fe. How can you justify this reduction with Ellingham diagram?
View SolutionFe2O3 can be reduced by CO gas below 1123K. How do you relate this statement with ellingham diagram?
View SolutionThe incorrect statement for Ellingham diagram is
View SolutionSelect the correct statements for Ellingham diagram.
View SolutionSelect the correct statements (Ellingham diagram) :
View SolutionThe correct statement regarding the given Ellingham diagram is :

View SolutionDraw the Ellingham diagram for the formation of carbon monoxide. What happens to the stability of carbon monoxide with the increase in temperature ?
View Solution

