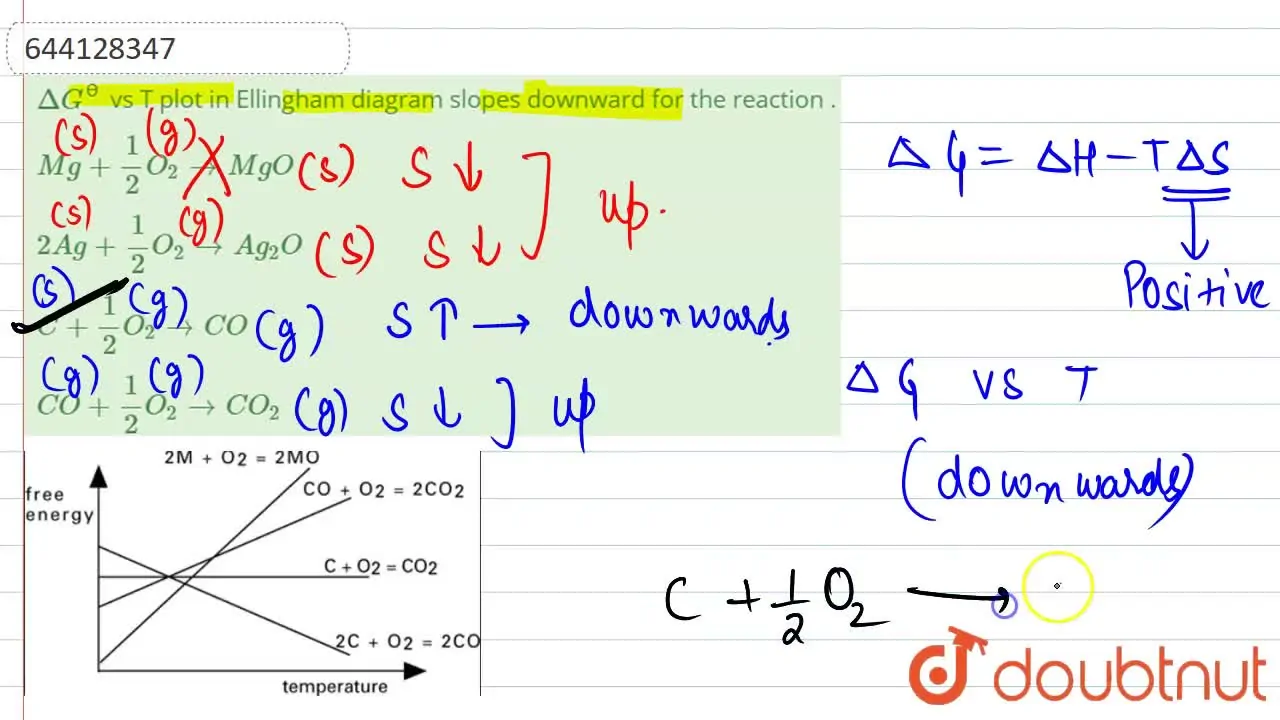
ΔGӨ vs T plot in Ellingham diagram slopes downward for the reaction .
Mg+12O2→MgO
2Ag+12O2→Ag2O
C+12O2→CO
CO+12O2→CO2
The correct Answer is:C
C(s)+12O2(g)→CO(g),ΔS increase. Hence, as the temperature increases, TΔS increases and hence ΔG(ΔH−TΔS) decreases. In other words. The slope of the curve for formation of CO decreases. Howeve, for all other oxides, it increases.
Related Playlists
- BOOK - CENGAGE CHEMISTRY ENGLISHCHAPTER - GENERAL PRINCIPLES AND PROCESS OF ISOLATION OF ELEMENTSEXERCISE - Exercise (Assertion-Reasoning)18videos
GENERAL PRINCIPLES AND PROCESS OF ISOLATION OF ELEMENTS
- BOOK - CENGAGE CHEMISTRY ENGLISHCHAPTER - GENERAL PRINCIPLES AND PROCESS OF ISOLATION OF ELEMENTSEXERCISE - Exercise (Integer)27videos
GENERAL PRINCIPLES AND PROCESS OF ISOLATION OF ELEMENTS
- BOOK - CENGAGE CHEMISTRY ENGLISHCHAPTER - GENERAL PRINCIPLES AND PROCESS OF ISOLATION OF ELEMENTSEXERCISE - Exercise (Multiple Correct)43videos
GENERAL PRINCIPLES AND PROCESS OF ISOLATION OF ELEMENTS
- BOOK - CENGAGE CHEMISTRY ENGLISHCHAPTER - ELECTROCHEMISTRYEXERCISE - Archieves Subjective35videos
ELECTROCHEMISTRY
- BOOK - CENGAGE CHEMISTRY ENGLISHCHAPTER - GRIGNARD REAGENTS AND ORGANOMETALLIC REAGENTSEXERCISE - Exercises Archives (Linked Comprehension)1videos
GRIGNARD REAGENTS AND ORGANOMETALLIC REAGENTS
Similar Questions
ΔG∘vsT plot in the Ellingham diagram slopes down for the reaction.
View SolutionEllingham diagrams are plots of ΔG∘1 Vs T for the formation of
View SolutionFor chemical reaction R→P the variation in the concentration (R ) vs .Time (t) plot given as
(i) predict the order of the reaction
(ii) what is he slope of the curve?View SolutionFor a sponaneous reaction, the free energy change must be negative, ΔG=ΔH−TΔS,ΔH is the enthalpy change during the reaction. T is the absolute temperature, and ΔS is the change in entropy during the reaction. Consider a reaction such as the formation of an oxide
M+O2→MO
Dioxygen is used up in the course of this reaction. Gases have a more random structure (less ordered) than liquid or solids. Consequently gases have a higher entropy than liquids and solids. In this reaction S (entropy or randomness) decreases, hence ΔS is negative. Thus, if the temperature is raised then TΔS becomes more negative,Since, TΔS is substracted in the equation, then ΔG becomes less negative. Thus, the free energy change increases with the increase in temperature.
The free energy changes that occur when one mole of common reactant (in this case dioxygen) is used may be plotted graphically aginst temperature for a number of reactions of metals to their oxides. The following plot is called an Ellingham diagram for metal oxide. Understanding of Ellingham diagram is extremely important for the efficient extraction of metals.
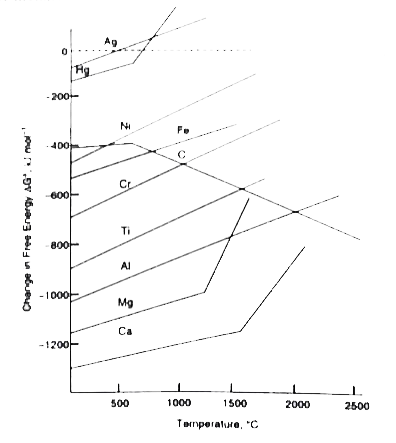
For the conversion of Ca(s) to Ca(s) which of the following represent the ΔG vs. T ?View SolutionFor a sponaneous reaction, the free energy change must be negative, ΔG=ΔH−TΔS,ΔH is the enthalpy change during the reaction. T is the absolute temperature, and ΔS is the change in entropy during the reaction. Consider a reaction such as the formation of an oxide
M+O2→MO
Dioxygen is used up in the course of this reaction. Gases have a more random structure (less ordered) than liquid or solids. Consequently gases have a higher entropy than liquids and solids. In this reaction S (entropy or randomness) decreases, hence ΔS is negative. Thus, if the temperature is raised then TΔS becomes more negative,Since, TΔS is substracted in the equation, then ΔG becomes less negative. Thus, the free energy change increases with the increase in temperature.
The free energy changes that occur when one mole of common reactant (in this case dioxygen) is used may be plotted graphically aginst temperature for a number of reactions of metals to their oxides. The following plot is called an Ellingham diagram for metal oxide. Understanding of Ellingham diagram is extremely important for the efficient extraction of metals.
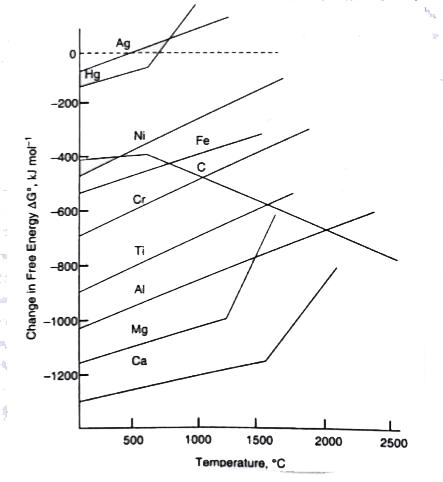
As per the Ellingham diagram of oxides which of the following conclusion is true ?View SolutionFor a sponaneous reaction, the free energy change must be negative, ΔG=ΔH−TΔS,ΔH is the enthalpy change during the reaction. T is the absolute temperature, and ΔS is the change in entropy during the reaction. Consider a reaction such as the formation of an oxide
M+O2→MO
Dioxygen is used up in the course of this reaction. Gases have a more random structure (less ordered) than liquid or solids. Consequently gases have a higher entropy than liquids and solids. In this reaction S (entropy or randomness) decreases, hence ΔS is negative. Thus, if the temperature is raised then TΔS becomes more negative,Since, TΔS is substracted in the equation, then ΔG becomes less negative. Thus, the free energy change increases with the increase in temperature.
The free energy changes that occur when one mole of common reactant (in this case dioxygen) is used may be plotted graphically aginst temperature for a number of reactions of metals to their oxides. The following plot is called an Ellingham diagram for metal oxide. Understanding of Ellingham diagram is extremely important for the efficient extraction of metals.
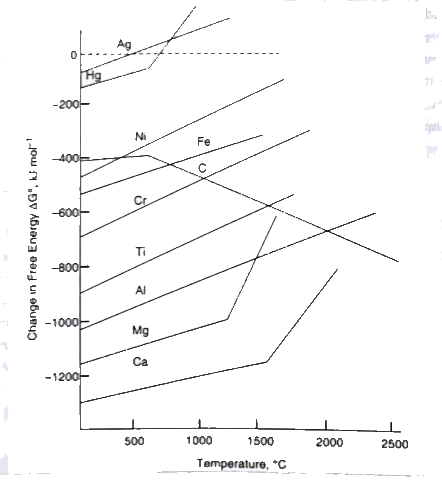
Which of the following elements can be prepared by heating the oxide above 400∘C ?View SolutionFor a sponaneous reaction, the free energy change must be negative, ΔG=ΔH−TΔS,ΔH is the enthalpy change during the reaction. T is the absolute temperature, and ΔS is the change in entropy during the reaction. Consider a reaction such as the formation of an oxide
M+O2→MO
Dioxygen is used up in the course of this reaction. Gases have a more random structure (less ordered) than liquid or solids. Consequently gases have a higher entropy than liquids and solids. In this reaction S (entropy or randomness) decreases, hence ΔS is negative. Thus, if the temperature is raised then TΔS becomes more negative,Since, TΔS is substracted in the equation, then ΔG becomes less negative. Thus, the free energy change increases with the increase in temperature.
The free energy changes that occur when one mole of common reactant (in this case dioxygen) is used may be plotted graphically aginst temperature for a number of reactions of metals to their oxides. The following plot is called an Ellingham diagram for metal oxide. Understanding of Ellingham diagram is extremely important for the efficient extraction of metals.
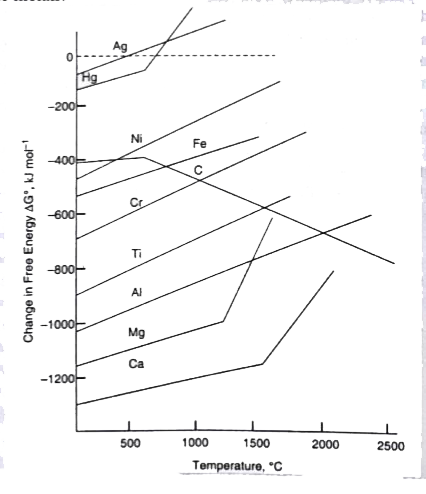
Free energy change of Hg and Mg for the convertion to oxides the slpe of ΔG vsT has been changed above the boiling points of the given metal because :View SolutionThe choice of reducing agent for metal oxide is decided by thermodynamic principles of metallurgy. ΔG must be negative. Ellingham diagram is a plot of ΔfG0 vs T for the formation of oxides of various elements. All the plots slope upwards when temperature increases. Each plot is a straight line except when some change in phase takes place. A metal will reduce the oxide of other metals which lie above it in this diagram.
At a temperature below 1623 K. Al cannot reduceView SolutionIn Ellingham diagrams plots of ΔfG (oxide formation) show positive slope except for the formation of CO(g) from coke. Why ?
View SolutionIn Ellingham diagrams plots of ΔfG (oxide formation) show positive slope except for the formation of CO(g) from coke. Why ?
View Solution

