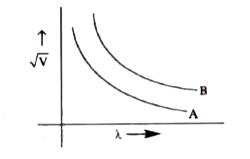
Plot a graph showing variation of de-Broglie wavelength associated with a charged particle of mass m, versus , where particle is accelerated. How does this graph give us the information regarding the magnitude of the charge of the particle?Solution in Punjabi
Step by step video & image solution for Plot a graph showing variation of de-Broglie wavelength (lambda) associated with a charged particle of mass m, versus 1/sqrtV, where particle is accelerated. How does this graph give us the information regarding the magnitude of the charge of the particle? by Physics experts to help you in doubts & scoring excellent marks in Class 12 exams.
Updated on:21/07/2023Similar Questions
Plot a graph showing variation of de-Broglie wavelength lamda versus 1/sqrtV , where V is accelerating potential for two particles A and B carrying same charge but of masses m_1, m_2 (m_1gt m_2) . Which one of the two represents a particle of smaller mass and why?
View SolutionThe graph showing the correct variation of linear momentum (p) of a charge particle with its de-Broglie wavelength (λ) is
View SolutionThe two lines shown in Fig. 17.20, for two particles with uniform charge, give de Broglie wavelength. lambda Of 1//sqrt(V) (V is the accelerator potential) is a graph as a function of. Which of these lines represents a particle with more mass?
View SolutionA particle of mass m kg and charge q coulomb is accelerated through V volt then the de-Broglie wavelength associated with it,in meter is λ=…..m.
View SolutionPlot a graph showing variation of de-broglie wavelength λ versus 1/√V, where V is accelerating potential for two particle A and P carrying same charge but of masses m1andm2(m1>m2). Which one of the two represents a particle of smaller mass and why?
View SolutionDraw a graph showing the variation of de Broglie wavelength of a particle of charge q and mass m with accelerating potential. Proton and deuteron have the same de Broglie wavelengths. Explain which has more kinetic energy.
View SolutionPlot a graph showing variation of a de Broglie wavelength (λ) associated with a charged particle of mass m, verses 1/√V, where V is the potential difference thrugh which the particle is accelerated.
View Solution√V of two particles A and B are plotted against de-Broglie wavelengths. where V is the potential on the particles. Which of the following relation is correct about the mass of particles?

View Solution