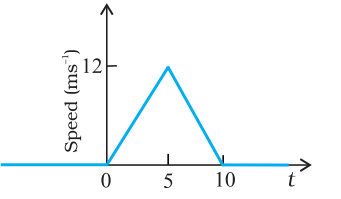
The speed-time graph of a particle moving along a fixed direction is shown in Fig. 3.28. Obtain the distance traversed by the particle between:-t = 0 s to 10 s,
 Solution in Punjabi
Step by step video & image solution for The speed-time graph of a particle moving along a fixed direction is shown in Fig. 3.28. Obtain the distance traversed by the particle between:-t = 0 s to 10 s, by Physics experts to help you in doubts & scoring excellent marks in Class 11 exams.
Updated on:21/07/2023Topper's Solved these Questions
- MOTION IN A STRAIGHT LINEBOOK - MBDCHAPTER - MOTION IN A STRAIGHT LINEEXERCISE - EXERCISE
14 Videos
- MOTION IN A PLANEBOOK - MBDCHAPTER - MOTION IN A PLANEEXERCISE - EXERCISE
17 Videos
- MOTION OF SYSTEM OF PARTICLES AND RIGID BODYBOOK - MBDCHAPTER - MOTION OF SYSTEM OF PARTICLES AND RIGID BODYEXERCISE - EXERCISE
15 Videos
Similar Questions
In which of the following examples of motion, can the body be considered approximately a point object:
View SolutionIs it necessary to mention the direction of a vector having zero magnitude?
View SolutionDefine centre of mass.
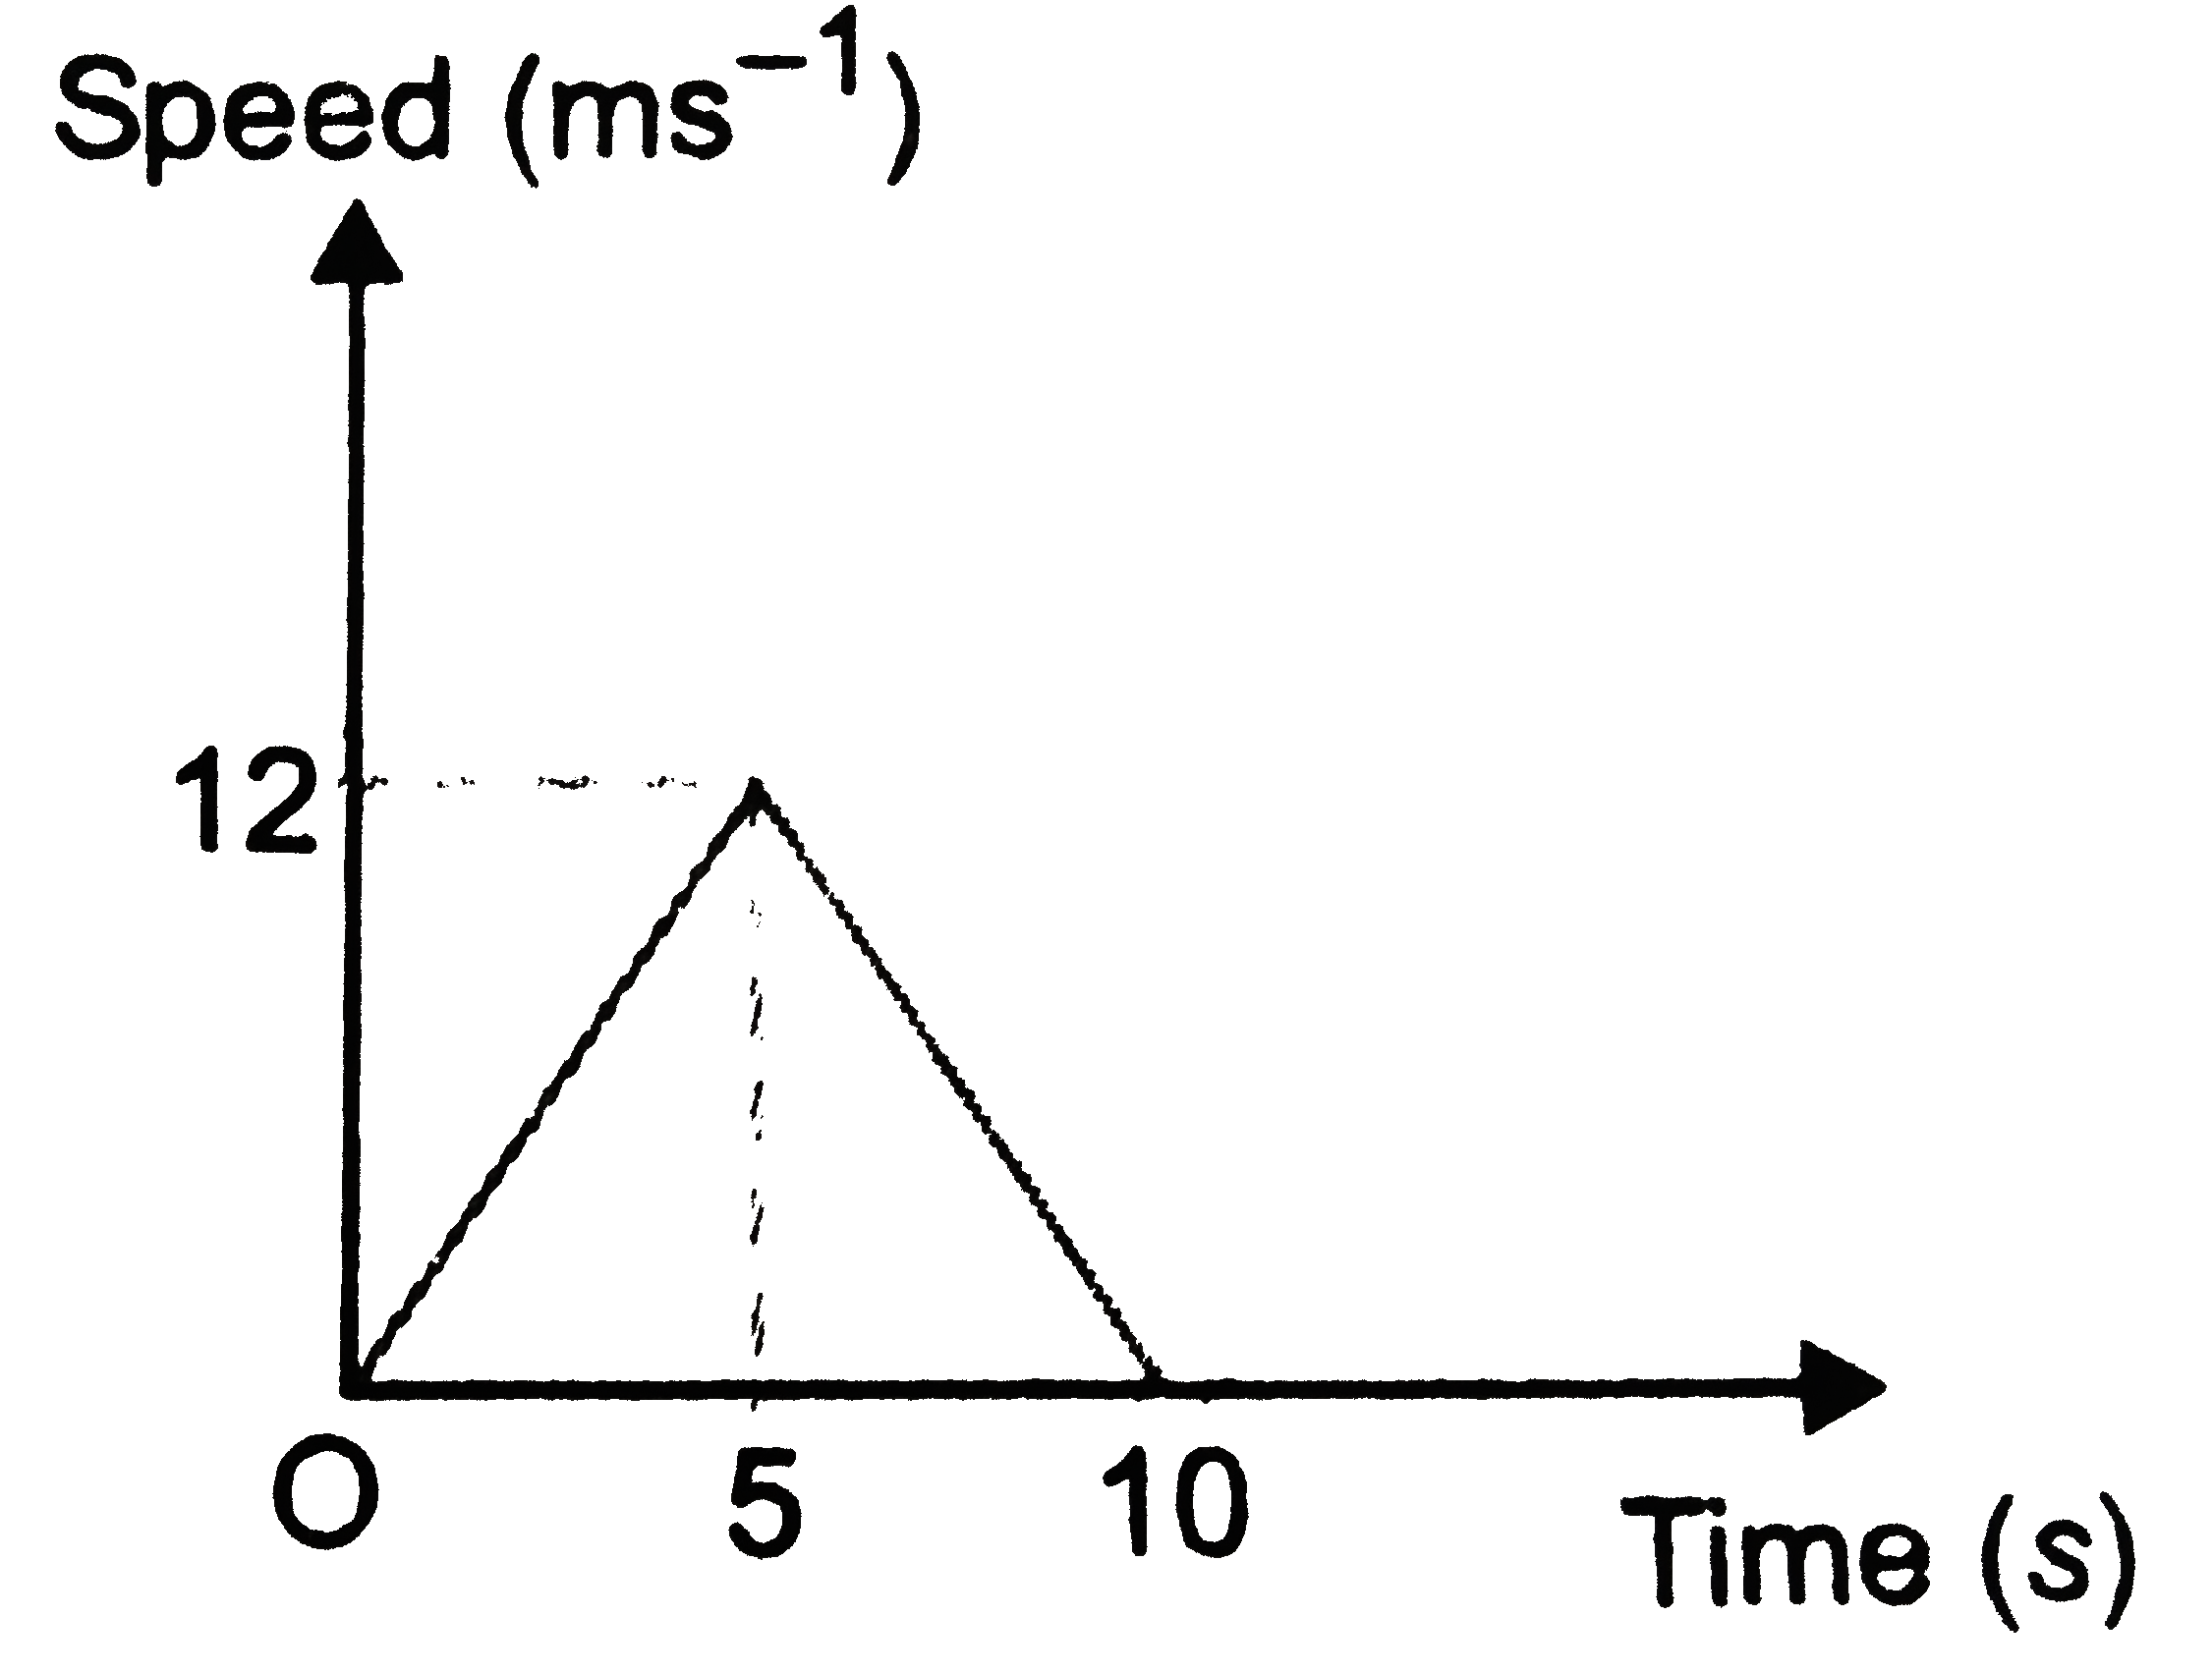
View SolutionThe speed-time graph of a particle moving along a fixed direction is shown in the Fig. 2 (CF) . 15. The distance traversed by the particle between t=2s 6s is .
 .
.
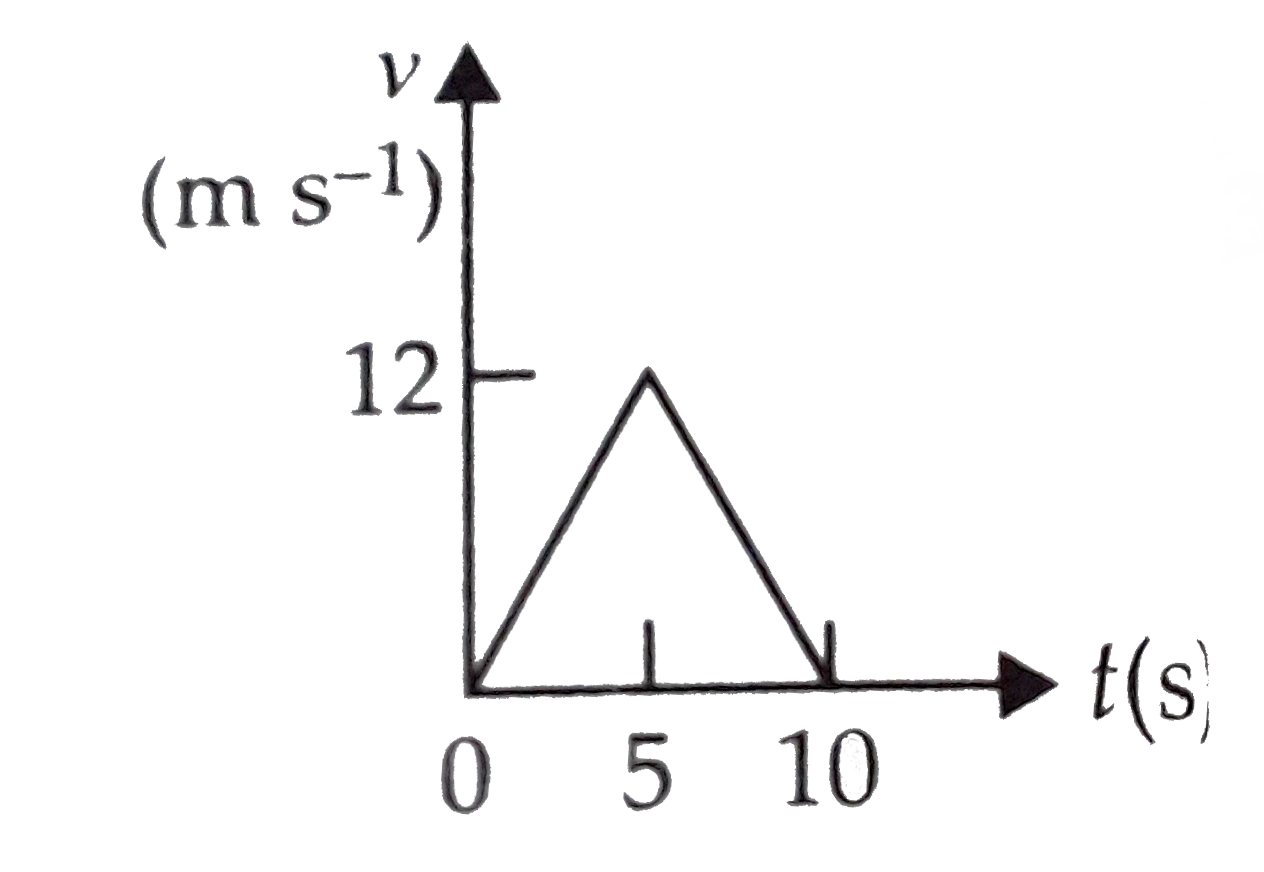
View SolutionThe speed-time graph of a particle moving along a fixed direction as shown in the figure. The distance transversed by the particle between t = 0 s to t = 10 s is
View Solutionकिसी निश्चित दिशा के अनुदिश चल रहे किसी कण का चाल-समय ग्राफ चित्र 3.28 में दिखाया गया है | कण द्वारा (a) t=0 s से t=10 s, (b) t=2 s से 6s के बीच तय की गई दूरी ज्ञात कीजिए |

(a) तथा (b) में दिए गए अंतरालों की अवधि में कण की औसत चाल क्या है ?
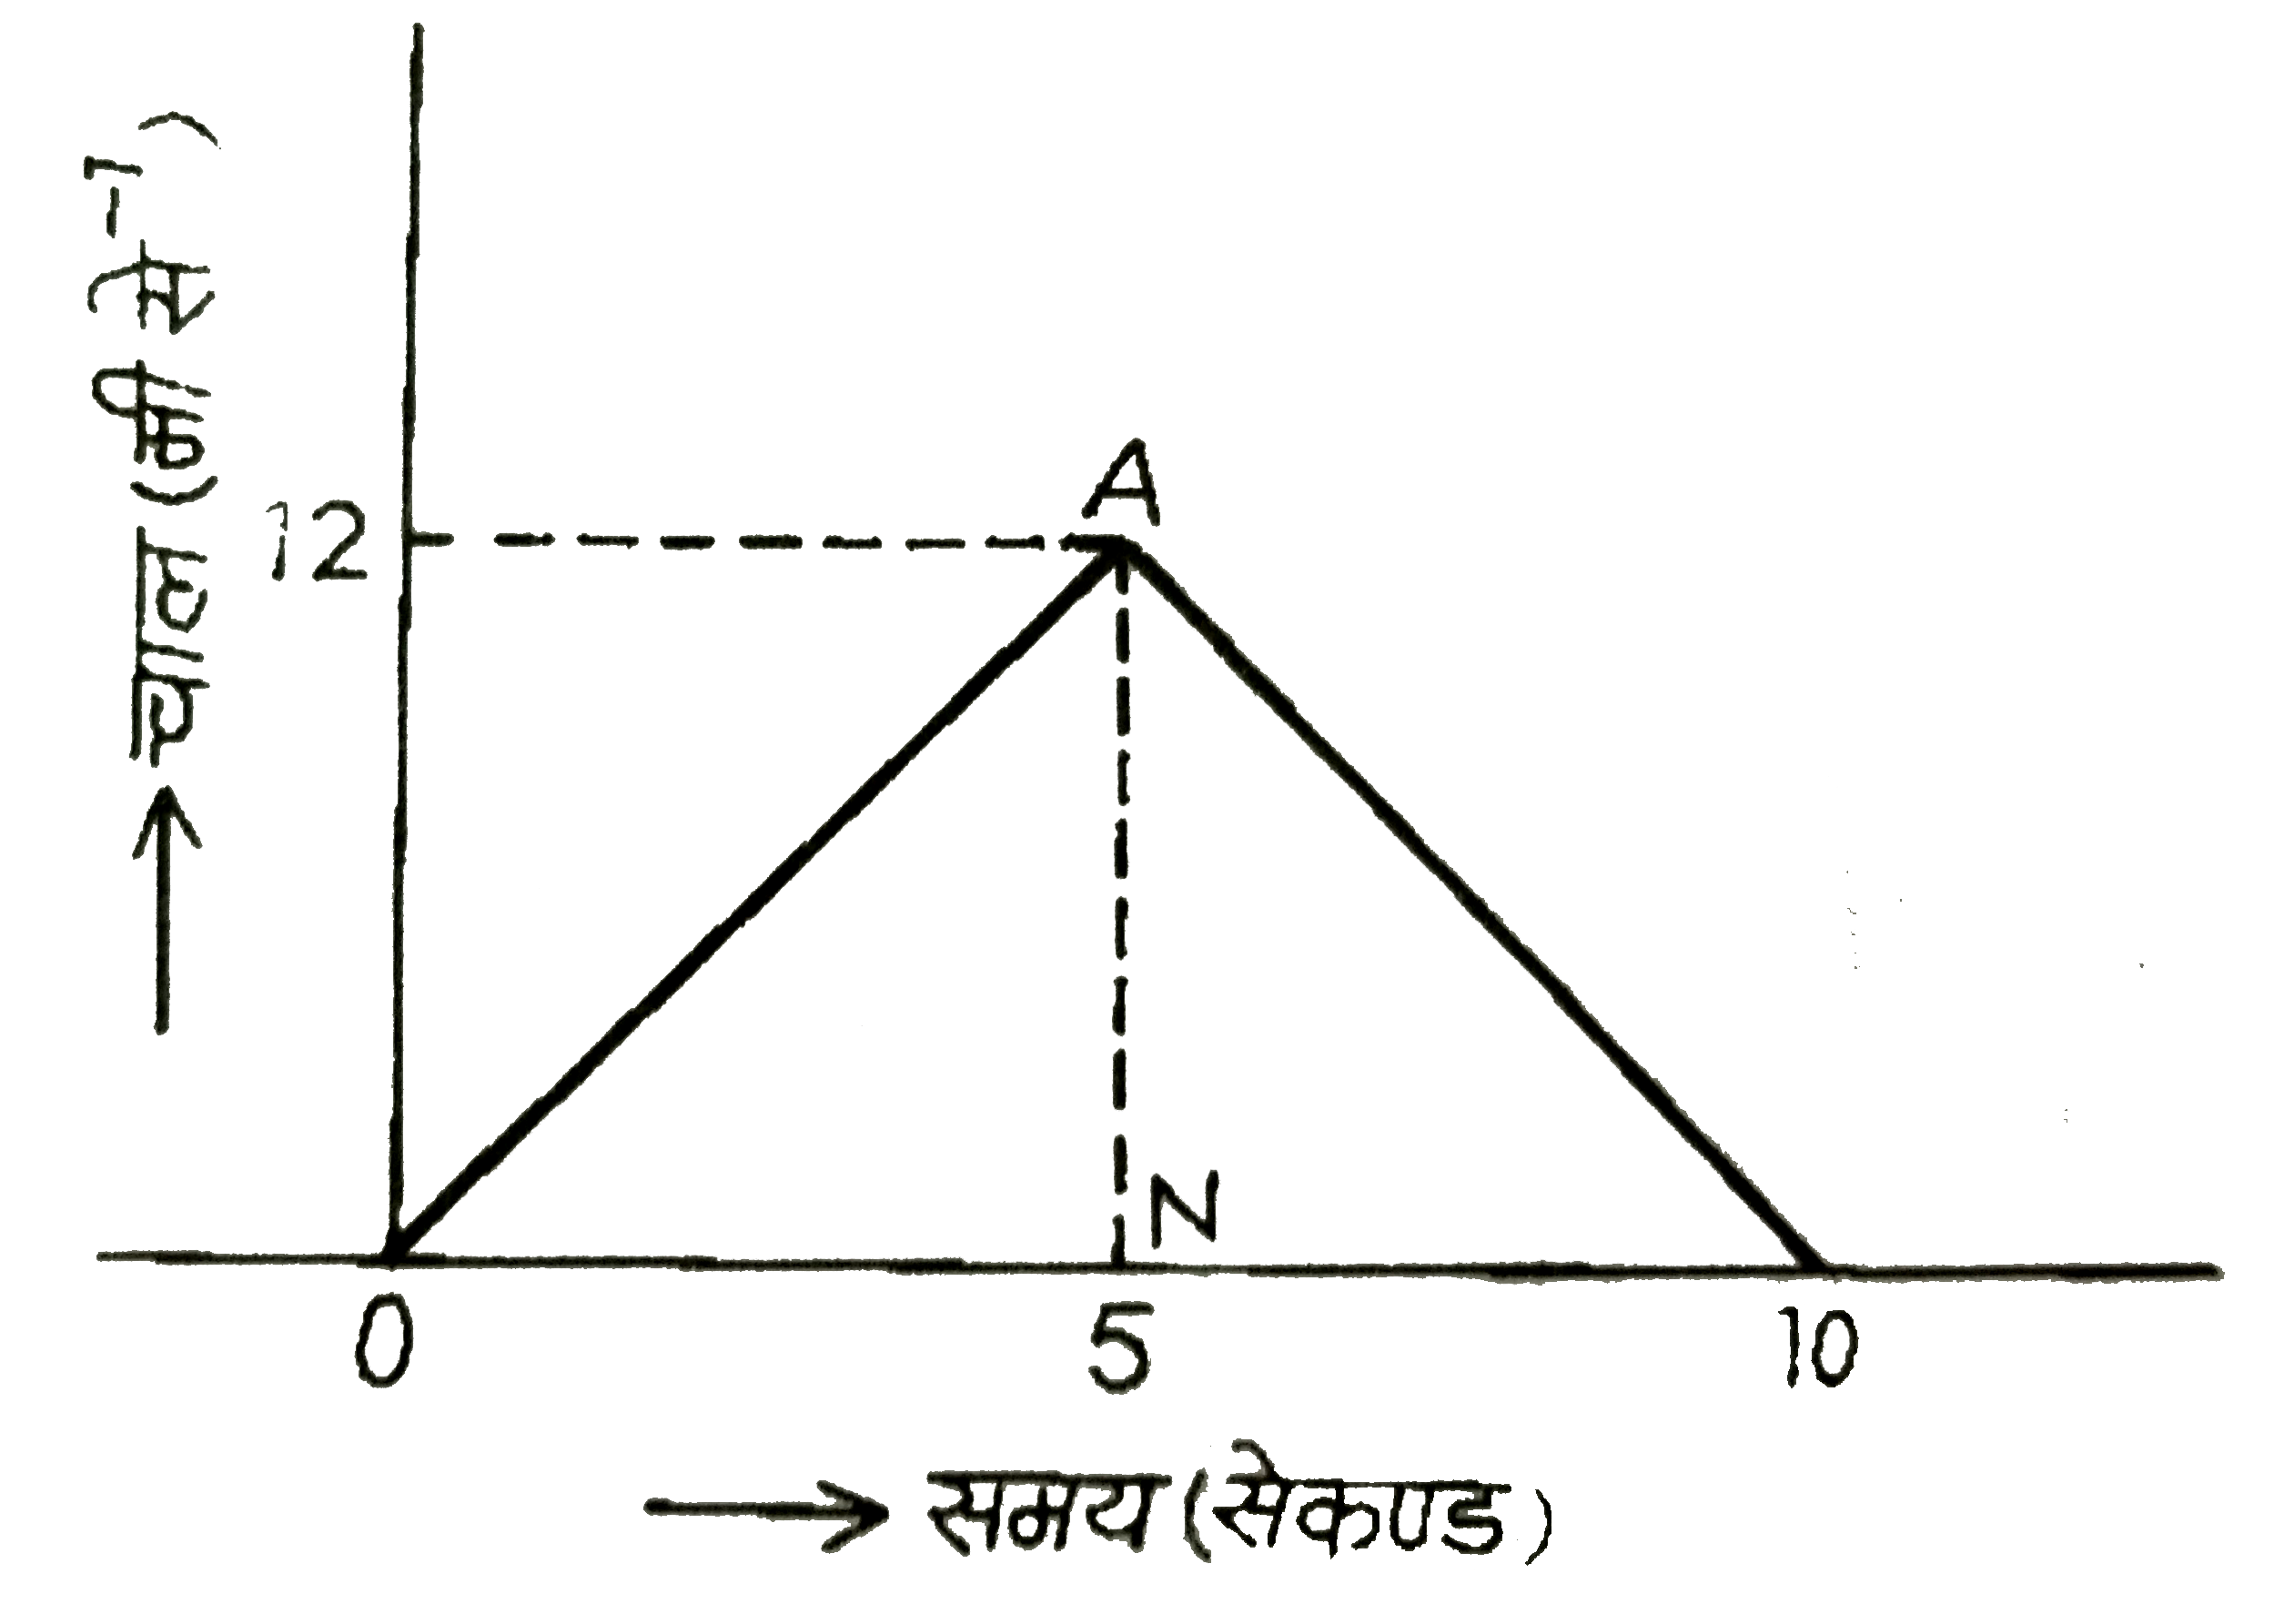
View Solutionकिसी निश्चित दिशा में अनुदिश चल रहे किसी कण का चाल-समय ग्राफ चित्र में दिखाया गया है । कण द्वारा (a) t=0s से t=10s, (b) t=2s से 6s के बीच तय की गई दूरी ज्ञात कीजिए । (c ) (a) तथा (b) में दिए गए अन्तरालों की अवधि में कण की औसत चाल क्या है ?
View SolutionThe position - time graph for a particle moving along a straight line is shown in figure. The total distance travelled by it in time t = 0 to t = 10 s is
View SolutionThe speed - time graph of a particle moving along a solid curve is shown below. The distance traversed by the particle from t = 0 to t = 3 is
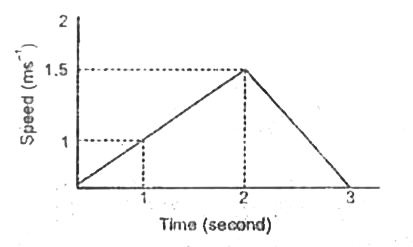
View SolutionThe speed-time graph of a particle moving along a fixed direction is shown in figure. Obtain the distance traversed by the particle between (a)t=0s to 10s(b)t=2s to 6s What is the average speed of the particle over the intervals in a and b?
View SolutionThe speed-time graph of a particle moving along a fixed direction is shown in Fig. Obtain the distance traversed by the particle between (a) t = 0 s to 10 s, (b) t = 2s to 6s.
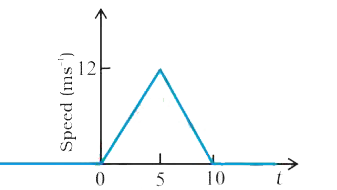
What is the average speed of the particle over the intervals in (a) and (b) ?
View SolutionThe speed-time graph of a particle moving along a fixed direction is shown in Fig. Obtain the distance traversed by the particle between (a) t = 0 s to 10 s, (b) t = 2s to 6s. What is the average speed of the particle over the intervals in (a) and (b) ?
View SolutionFind the distance travelled by the particle during the time t = 0 to t = 3 second from the figure .
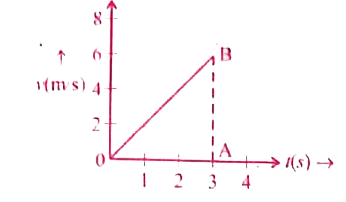
View Solutionकिसी निश्चित दिशा में गतिमान किसी कण के चाल-समय ग्राफ को चित्र में दर्शाया गया है। कण के द्वारा t=2 s से t=6 s के मध्य तय की गई दूरी है-
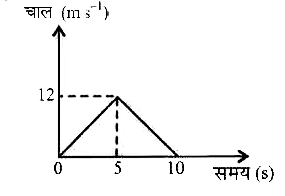
View SolutionThe speed-time graph of a particle moving along a fixed direction is shown in the Fig. The distance traversed by the particle between (a) t=0s→10s .
 .
what is the average speed of the particle over the intervals?
View SolutionThe speed-time graph of a particle moving along a fixed direction is shown in figure. Obtain the distance traversed by the particle between (a) t =0 s to 10s. (b) t = 2 s to 6s. What is the average speed of the particle over the intervals in (a) and (b) ?
View Solution
