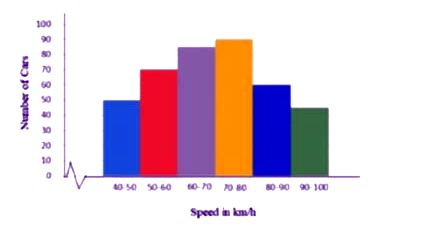
The given histogram shows the frequency distribution of the speed of cars passing through a particular spot on a lighway. Read the graph and answer the following question.
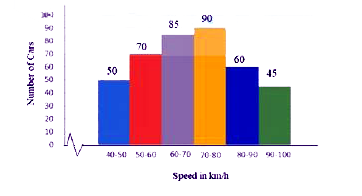
The number of cars with speed (km/h) in the interval (60 - 70) km/h is what percentage less than the number of cars with speed (km/h) in the interval (70-80) km/h? (correct to one decimal place)
0.056
0.075
0.086
0.059
Step by step video & image solution for The given histogram shows the frequency distribution of the speed of cars passing through a particular spot on a lighway. Read the graph and answer the following question. The number of cars with speed (km/h) in the interval (60 - 70) km/h is what percentage less than the number of cars with speed (km/h) in the interval (70-80) km/h? (correct to one decimal place) by Maths experts to help you in doubts & scoring excellent marks in Class 14 exams.
Related Playlists
Similar Questions
The given histogram shows the frequency distribution of the speed of cars passing through a particular spot on a highway. Read the graph and answer the following question.
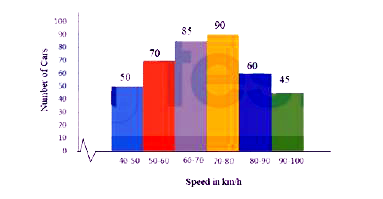
What percentage of cars were running with the speed of 90 km/h and above?View SolutionThe given histogram shows the frequency distribution of the speed of cars passing through a particular spot on a highway. Read the graph and answer the following question.
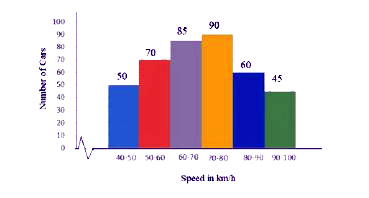
What is the ratio of the number of cars with speed less than 60 km h to the number of cars with speed more than 70 km/h?View SolutionThe given histogram shows the frequency distribution of the speed of cars passing though at a particular spot on a highway. Study the graph and answer the question that follows
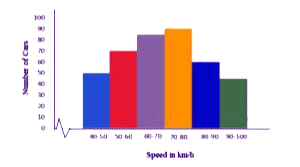
The number of cars with speed between 70km/h and 80km/h is what percentage more than the number of the cars with speed between 50 km/h and 60 kmh ? (correct to one decimal place)View SolutionThe given histogram shows the frequency distribution of the speed of cars passing though at a particular spot on a highway. Study the graph and answer the question that follows.
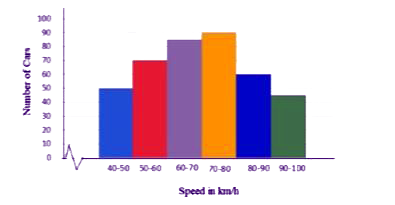
What percentage of cars were running with speed less than 70 km/h?View SolutionThe given histogram shows the frequency distribution of the speed of cars passing though at a particular spot on a highway. Study the graph and answer the question that follows.
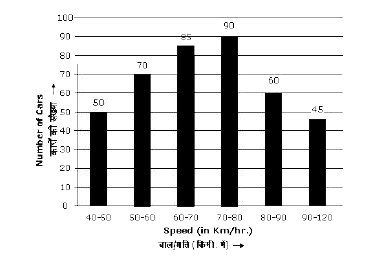
What is the ratio of the number of cars with speed less than 60 km/h to the number of cars with speed more than 80 km/h?View SolutionIn the given histogram what percentage of cars were running with the speed less than 60km/h
 View Solution
What is the average speed of the car if it travels a distance of d km in t h ?
View SolutionIf a person travels 60 km in 4 h in a car, then the speed of the car is ____.
View SolutionA person car row with the stream at 8 km/h and against the stream at 6 km/h. The speed of the current in km/h is
View SolutionA car increases its speed form 20km/h to 50km/h in 10 seconds. Its acceleration is
View Solution


