The given bar graph shows the sales of cars from six branches of a dealer B1 , B2 , B3, B4 ,B5,B6, during two consecutive years and 2018 and 2019 .Blue colour corresponds to the year 2018 and red colour corresponds to the year 2019 .
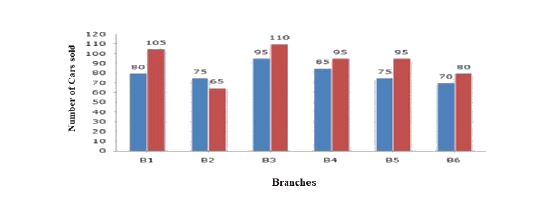
The average sale of cars (from all branches ) for the year 2018 is :
80
90
78
85
Step by step video solution for The given bar graph shows the sales of cars from six branches of a dealer B1 , B2 , B3, B4 ,B5,B6, during two consecutive years and 2018 and 2019 .Blue colour corresponds to the year 2018 and red colour corresponds to the year 2019 . The average sale of cars (from all branches ) for the year 2018 is : by Maths experts to help you in doubts & scoring excellent marks in Class 14 exams.
Related Playlists
Similar Questions
The given bar graph shows the sales of cars from six branches of a dealer B1,B2,B3,B4,B5,B6 . During two consecutive years 2018 and 2019 .Blue colour corresponds to the year 2018 and red colour corresponds to the year 2019 .

The total sale of cars from all the branches in the year 2018 is what percentage less than the total sales of cars from all the branches in the year 2019 ? (correct to one decimal place)View SolutionThe given bar chart shows the sales of books from six branches of a publishing company during two consecutive years 2000 and 2001.
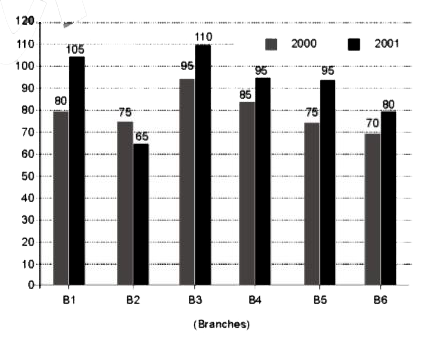
In the given bar chart, total sales of branches B1,B3 and B5 taken together for both the years isView SolutionThe given bar chart shows the sales of books from six branches of a publishing company during two consecutive years 2000 and 2001.
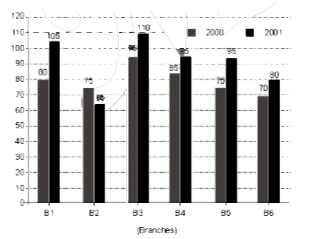
In the given bar chart, the ratio of total sales of all branches for the year 2000 to 2001 is:View SolutionThe given bar graph present the sales of the number of books by six branches of a publishing company during two consecutive years 2000 and 2001.
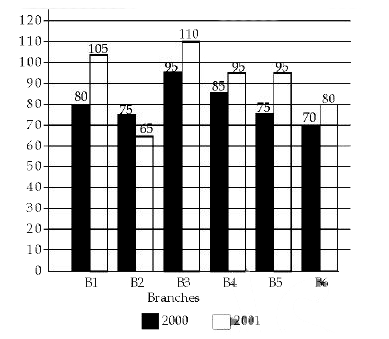
The ratio of total sales by all branches for the year 2001 to total sales by all branches for the year 2000 is:View SolutionBar-chart showing the Sales of Books (in 1000) from six-branches B1,B2,B3,B4,B5andB6 of a Publishing Company in 2000 and 2001 is given below. Study the chart and answer the questions.
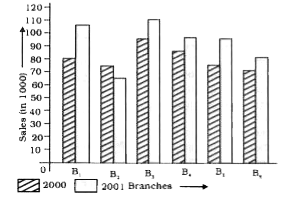
What is the average sales of books from all the branches for the year 2000?View SolutionIn the following bar diagram sales of books (in thousand numbers) from six branches - B1, B2, B3, B4, B5 and B6 of a publishing company in 2009 and 2010 have been shown. Study the graph and answer the questions.
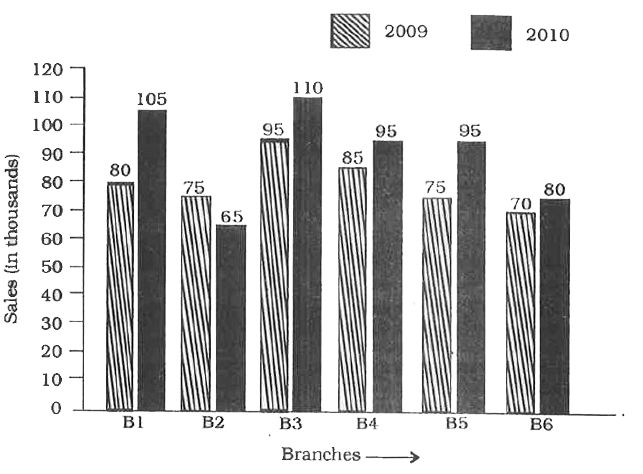
Total sales of branch B6 for both the years is x per cent of the total sales of branch B3 for both the years. The value of x isView SolutionThe given Bar Graph present the sales of the number of books (in thousands) by six branches of a publishing company during two consecutive years 2000 and 2001.
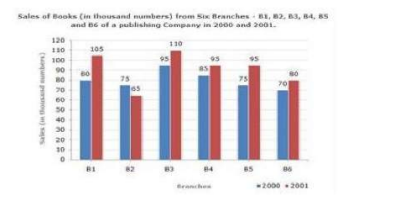
The total sales (in thousands) by all branches for both years is:View SolutionThe given Bar Graph present the sales of the number of books (in thousands) by six branches of a publishing company during two consecutive years 2000 and 2001.
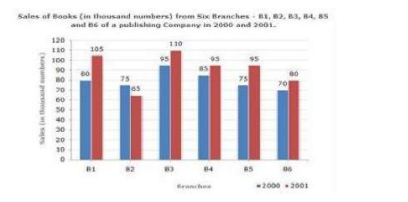
The ratio of the sales by all branches for the year 2001 to total sales by all branches for the year 2000 is:View SolutionThe given bar graph represents the number of students admitted in four schools (S1, S2, S3, S4) during two consecutive years 2017 and 2018.
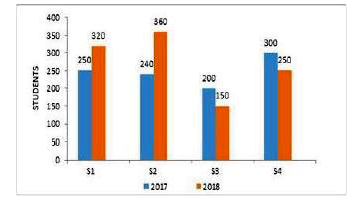
What is the average number of students admitted to all schools in 2018?View SolutionThe given bar chart shows the sales of books from six branches of a publishing company during two consecutive years 2000 and 2001.
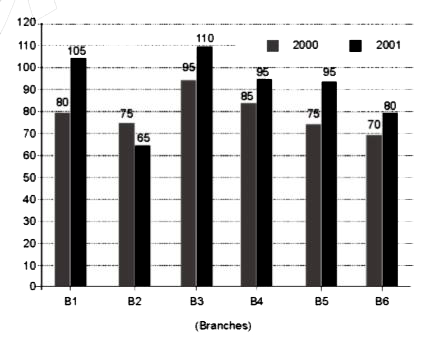
In the given bar chart, the ratio of total sales of all branches B1,B3 and B5 to total sales of branches B2,B4 and B5 taken together for both the yearsView Solution


