Draw the graph of the function f(x)=(1+1x)2Solution in Tamil
f(x)=(1+1x)x,f(x) is defined if 1+1x>0
⇒x+1x>0⇒(−∞,−1)∪(0,∞)
Now f′(x)=(1+1x)x[ln (1+1x)+x1+1x−1x2]
=(1+1x)(x)[ln (1+11x)−1x+1]
Now (1+1x)x is always positive, hence the sign of the f′(x) depends on the sign of ln (1+1x)−1x+1
Let g(x)=ln (1+1x)−1x+1
g′(x)=11+1x−1x2+1(x+1)2=−1x(x+1)2.
For x∈(0,∞),g′(x)<0.
So g(x) is monotonically decreasing for x∈(0,∞). Thus,
g(x)>limx→∞g(x)
⇒g(x)>0
⇒f′(x)>0
For x∈(−∞,−1),g′(x)>0.
So g(x) is monotonically increasing in its domain.
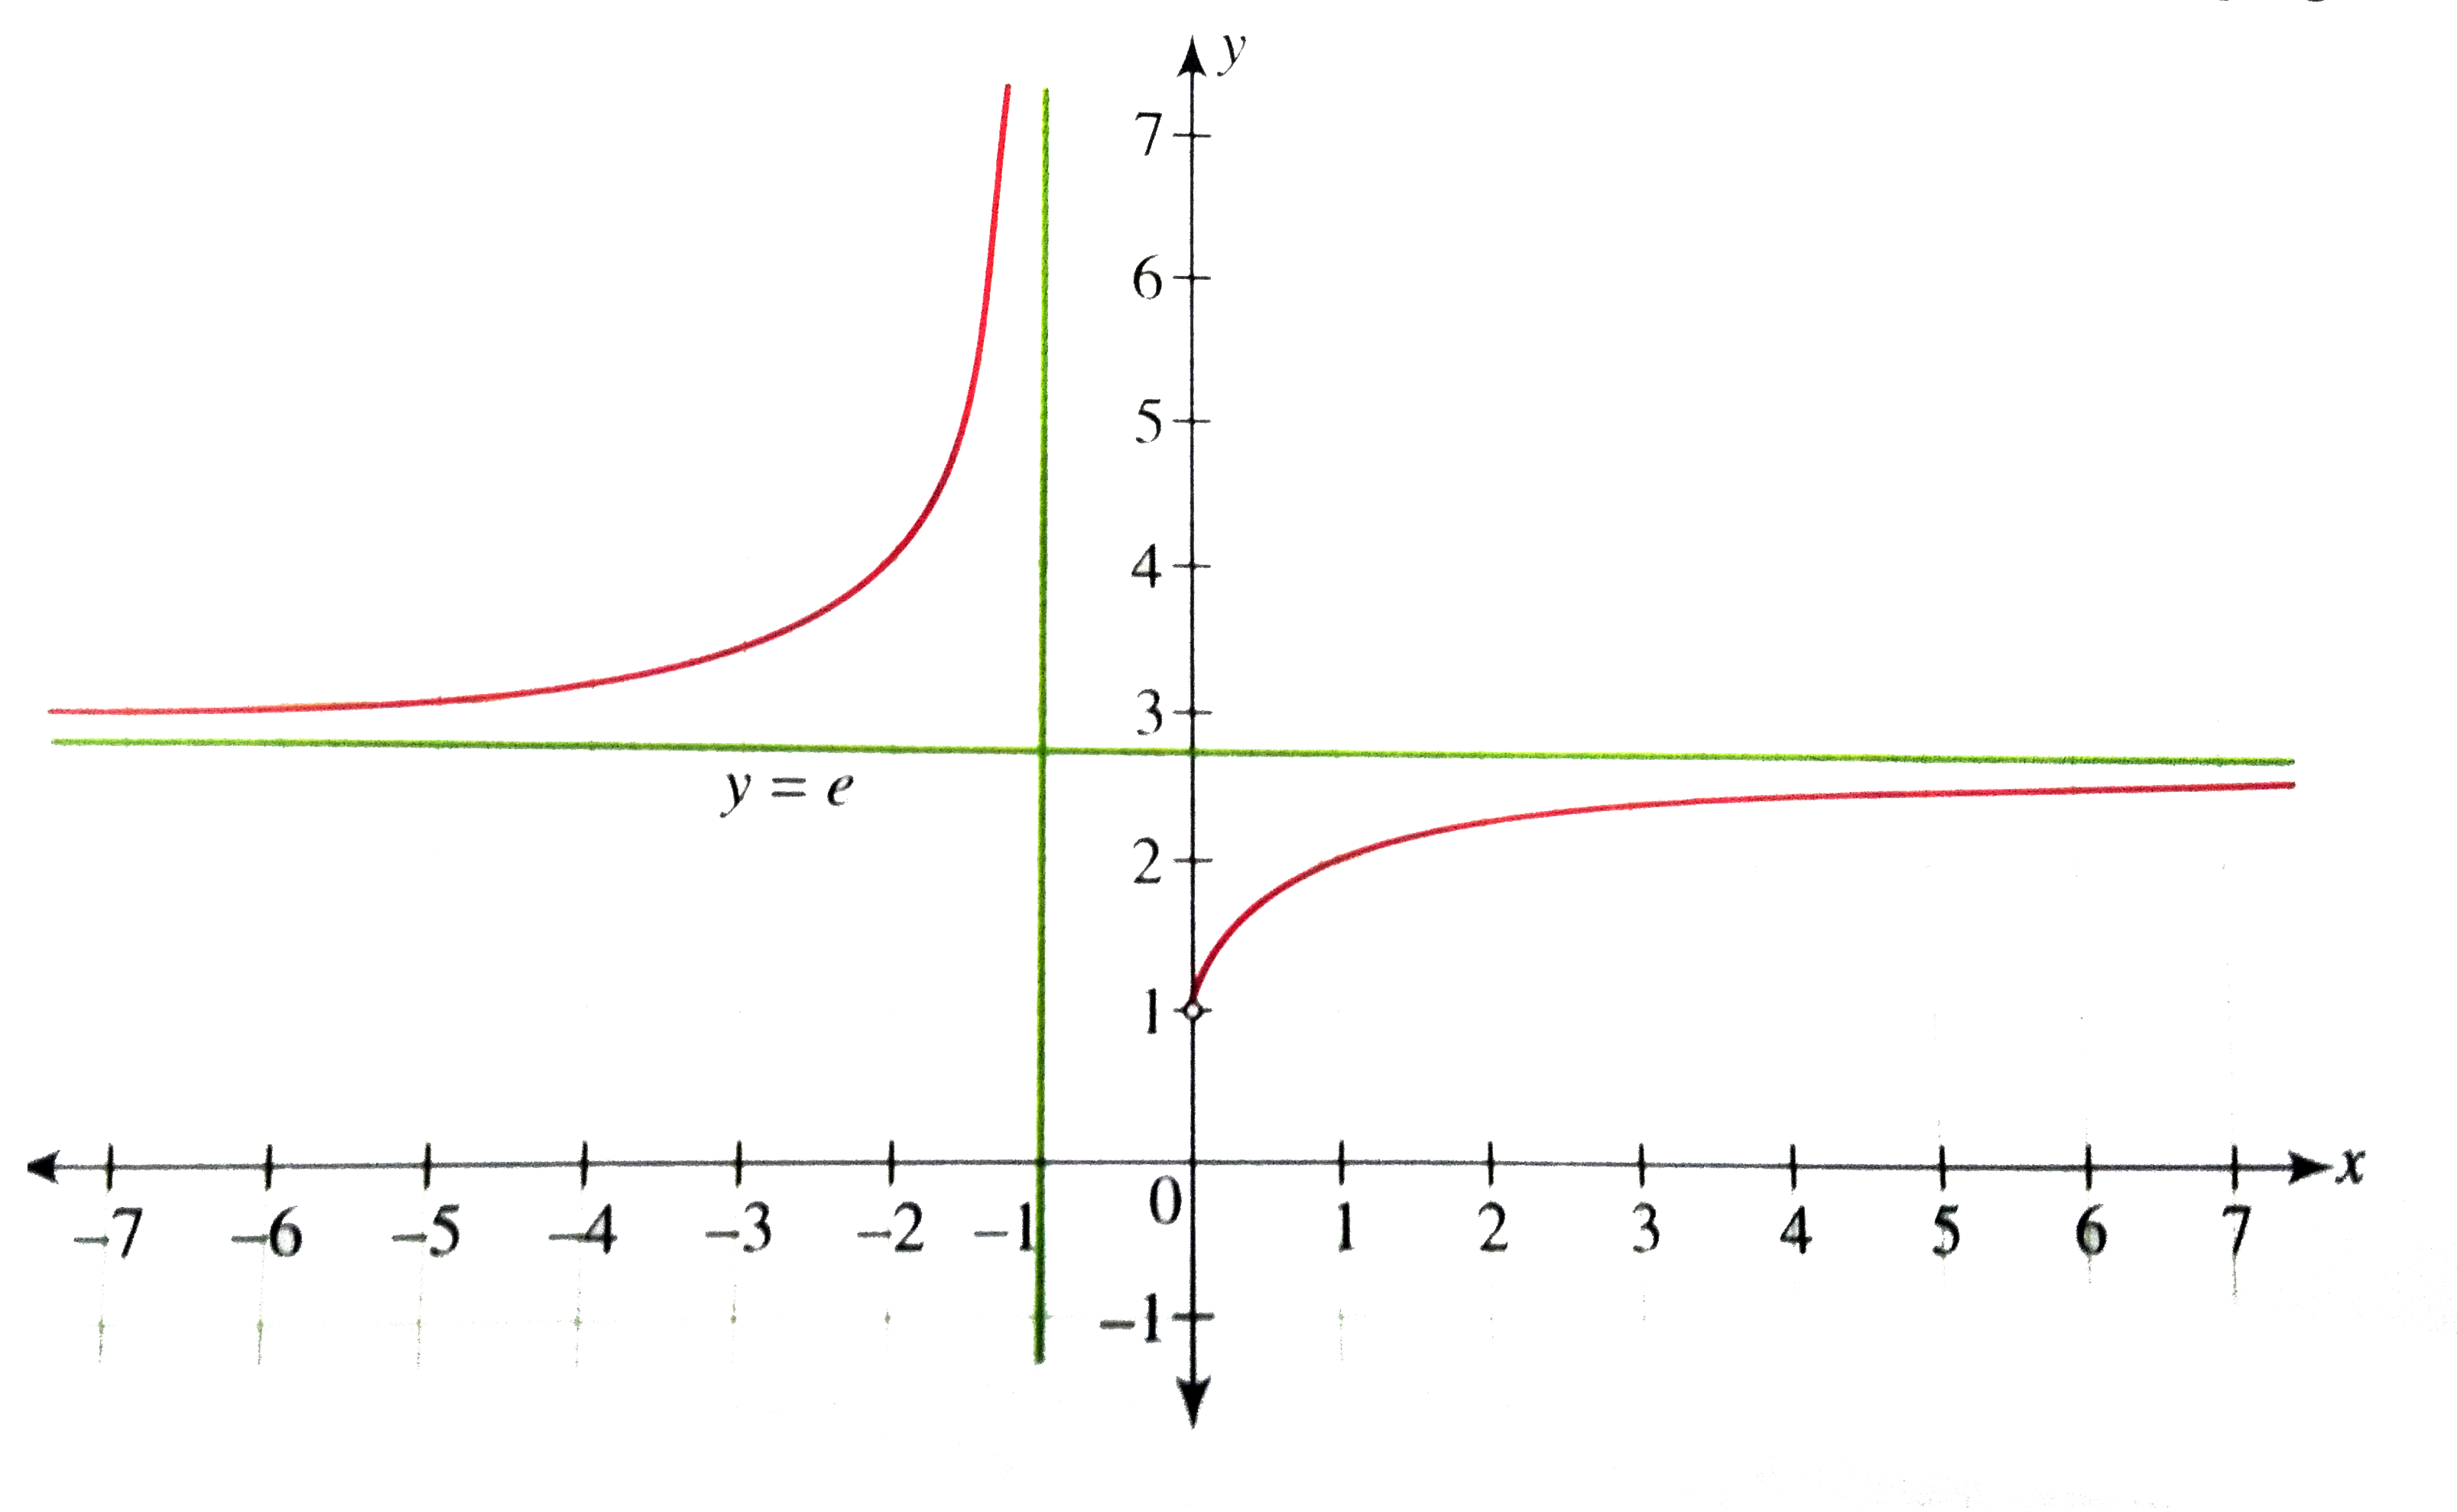
Also limx→±∞(1+1x)x=e
x→±∞(1+1x)x=e
limx→0+(1+1x)x=1 and limx→1(x+1x)x=∞
From the above discussion the graph of the function is as shown in the following figure.

Range is y∈(1,∞)−{e}
Topper's Solved these Questions
Similar Questions
Draw the graph of y=sin2x−cosx
View SolutionLet →a and →b be two vectors of equal magnitude 5 units. Let →p,→q be vectors such that →p=→a−→b and →q=→a+→b. If |→p×→q|=2{λ−(→a.→b)2}12, then value of λ is
View SolutionSolve: (x+2)3=2x(x2−1)
View SolutionDraw the graph of the function: f(x)=−|x−1|12
View SolutionDraw the graph of the following function: f(x)=sin−1(x+2)
View SolutionDraw the graph of the function y=f(x)=tan−1(1−x21+x2).
View SolutionDraw the graph of the function f(x)=(1+1x)2
View SolutionDraw the graph of the functions f (x) = |x|, f(x) = |x-1| and f(x) = (x−1)2
View SolutionDraw the graph of the function, f(x)=1x.
View SolutionDraw the graph of the function: f(x)=|1−x|+|1+x|,−2≤x≤2
View SolutionDraw the graph of the function: f(x)=−|x−1|12
View SolutionDraw the graph of the function y=f(x)=tan−1(1−x21+x2).
View SolutionDraw the graph of the function f(x)=(1+1x)2
View SolutionDraw the graph of the function f(x)=|x−1|
View SolutionDraw the graph of the following function. f(x+1)
View Solution

