Draw the graph of the function y=f(x)=tan−1(1−x21+x2).
Video Solution
Text Solution
y=f(x)=tan−1(1−x21+x2)
tan−11−tan−1x2
=π4−tan−1x2
Clearly, the domain of the function is R and X2≥0,∀x∈R.
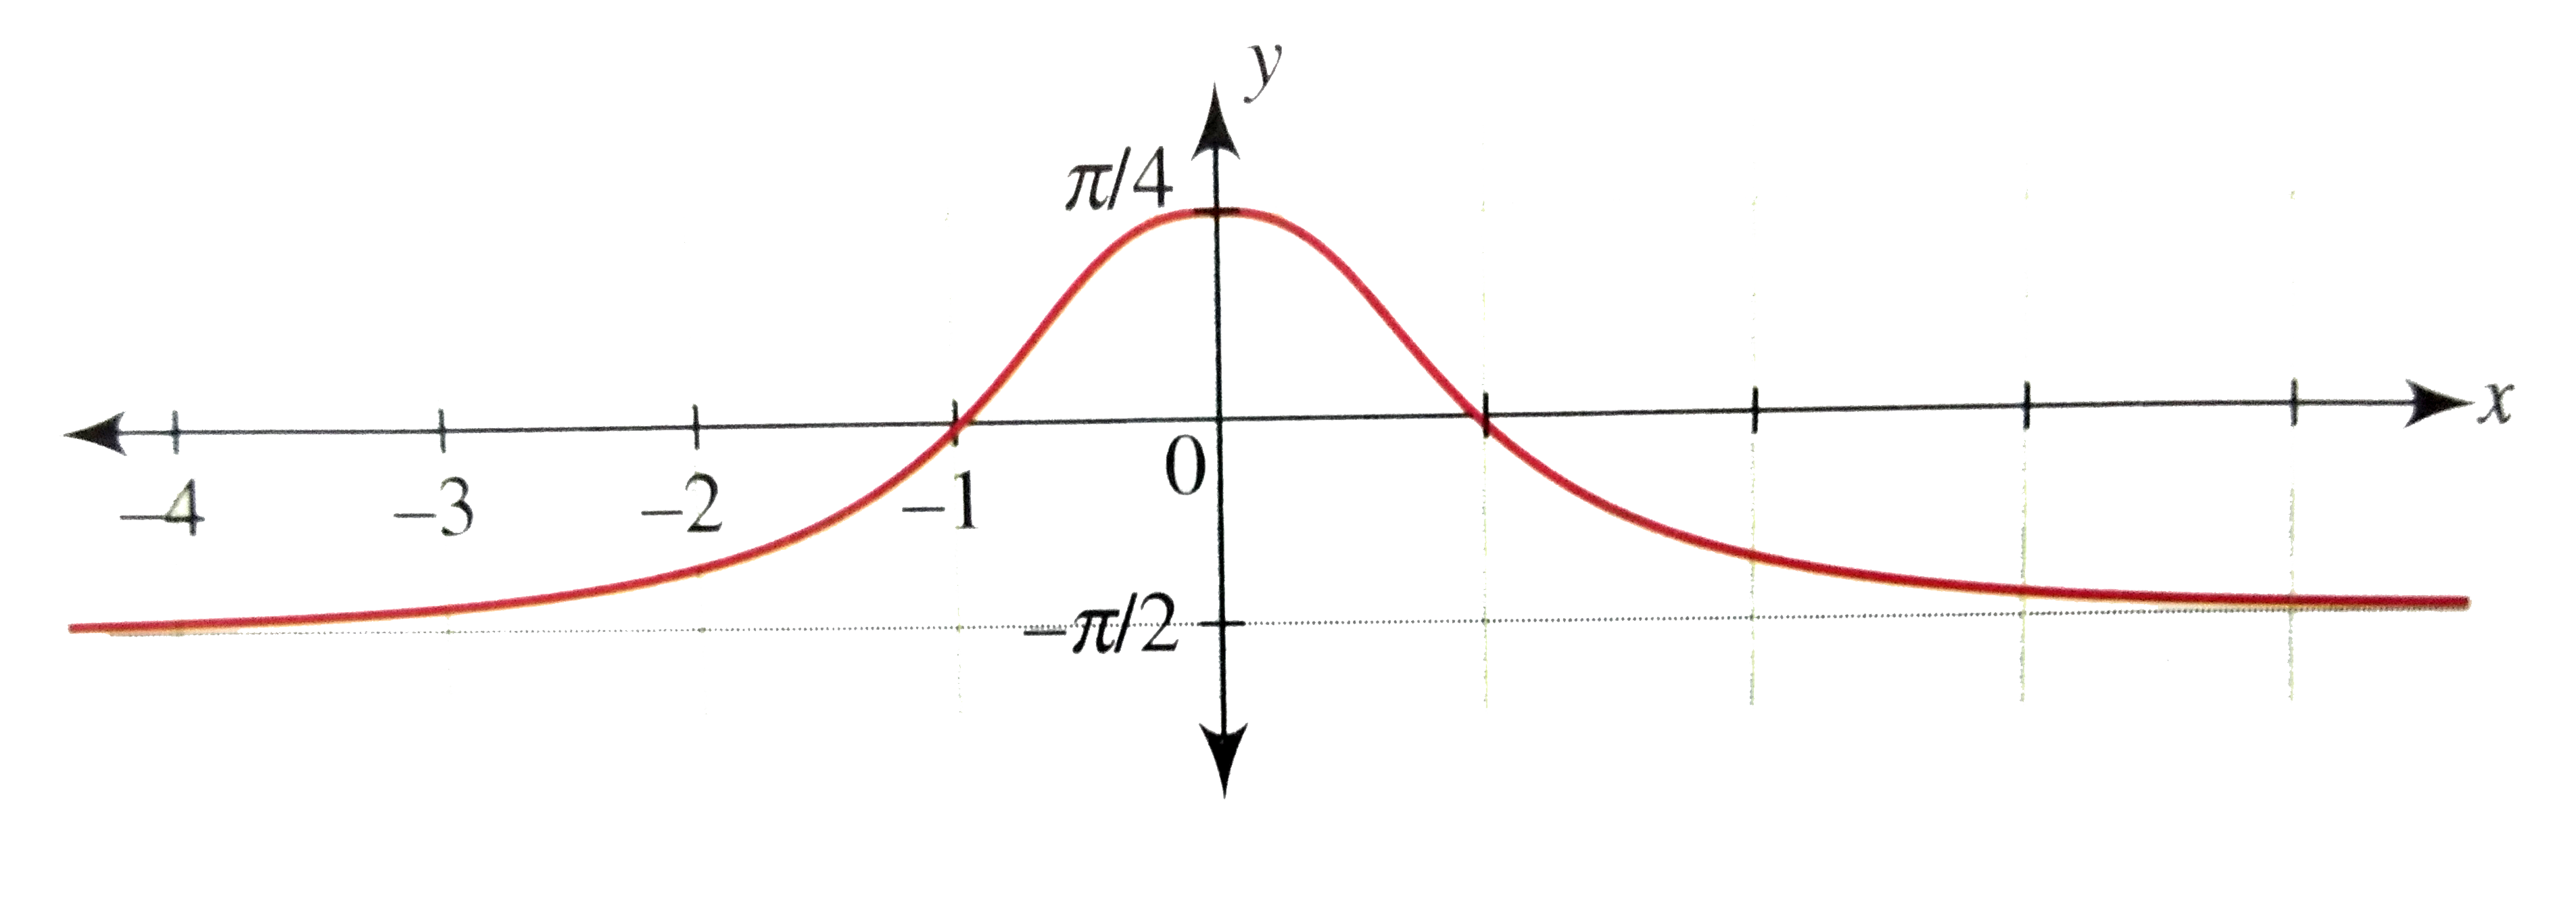
Also function is even therefore the graph is symmetrical about the y-axis.
tan−1x2≥0∴tan−1x2∈[0,π2)
∴ tan−1x2∈(π2,0]
∴ π4−tan−1x2∈(−π4,π4]
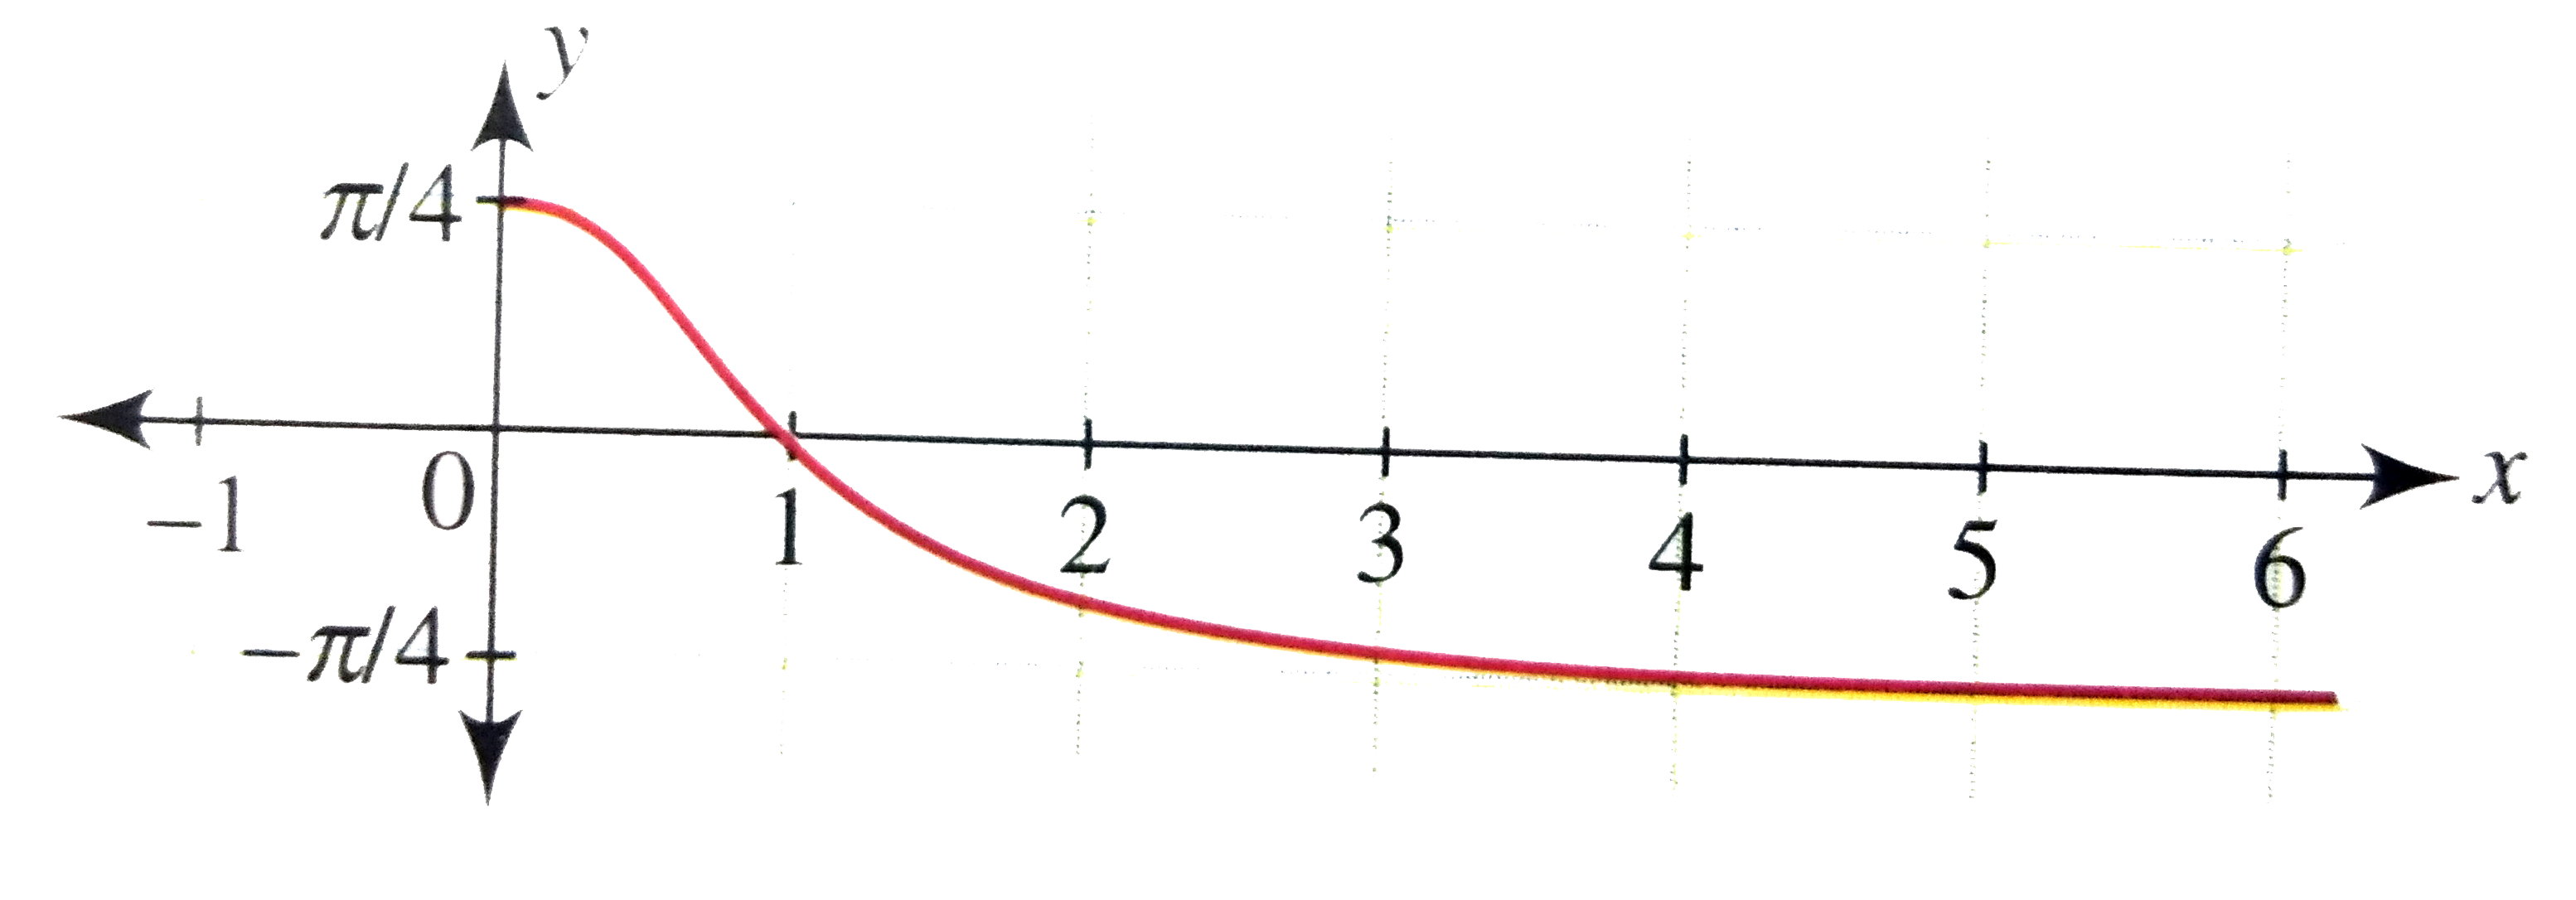
Lets us first draw the graph for x≥0.
f(0)=π4−tan−10=π4
Now if we increase the value of x from x=0, we find that the value of x2 increases, so the value of tan−1x2 increases. Hence the value of π4−tan−1x2 decreases.
When x→,π4−tan−1x2⊤i4−π2=π4
Also when π4−tan−1x2=0,tan−1x2=π4∴x=1
Thus, the graph intersects the x-axis at (1,0).
Thus, the graph of f(x) for x≤0 is as whown in the following figure.

Since f(x) is an even function, the graph is symmetrical about the y-xis, heance the graph of the function is as shown in the following figure.

Here f'(x)=00-0(2x)/(1+x^(2)),∴f(x)isd⇔erentiab≤atx=0.<br>Alsof(x)=2(x^(2)-1)/((1+x^(2))^(2))<br>f"(x) = 0 therefore x = +-1,wherethegraphoff(x)chan≥sitsconcavity.<br>Forx in (-1, 1), f"(x) lt0,wheretghegraphisconcavedownwards.<br>Forx in (-oo, -1)cup (1, oo), f"(x) lt0, where the graph is convace upwards.
|
Topper's Solved these Questions
- GRAPH OF INVERSE TRIGONOMETRIC FUNCTIONSBook:CENGAGE ENGLISHChapter:GRAPH OF INVERSE TRIGONOMETRIC FUNCTIONSExercise:Exercises
Explore 18 Videos
- GETTING STARTED WITH GRAPHSBook:CENGAGE ENGLISHChapter:GETTING STARTED WITH GRAPHSExercise:Exercises 1.18
Explore 1 Video
- GRAPHICAL TRANSFORMATIONSBook:CENGAGE ENGLISHChapter:GRAPHICAL TRANSFORMATIONSExercise:ILLUSTRATION
Explore 78 Videos
Similar Questions
Draw the graph of the function f(x)=|x−1|
View SolutionDraw the graph of the function f(x)=(1x)x
View SolutionDraw the graph of the function f(x)=(1+1x)2
View SolutionDraw the graph of the function: f(x)=−|x−1|12
View SolutionDraw the graph of function. y=1|x|
View SolutionDraw the graph of the function: f(x)=∣∣x2−3∣∣x|+2|
View SolutionDraw the graph of the following function: f(x)=sin−1(x+2)
View Solutiondraw the graph of function. y=|x|−x2
View SolutionDraw the graph of the following function.
f(x+1)
View SolutionDraw the graph of y=2x−1
View Solution

