Given is a line graph showing the number of accidents in a city during the first 6 months of 1999.
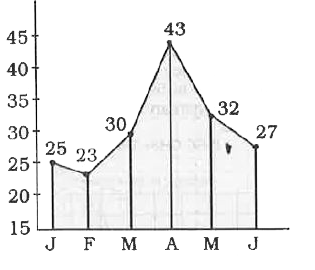
The decrease % of accidents from May to June is
1538%
1518%
1558%
1578%
Step by step video & image solution for Given is a line graph showing the number of accidents in a city during the first 6 months of 1999. The decrease % of accidents from May to June is by Maths experts to help you in doubts & scoring excellent marks in Class 14 exams.
Related Playlists
Similar Questions
The bar-chart is showing the number of accidents in a city during the first six month of a year. Examine the bar chart and answer the following questions.
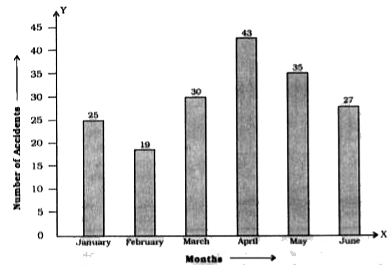
Percentage of decrease in t he number of accidents from May to June is :View SolutionThe bar-chart is showing the number of accidents in a city during the first six month of a year. Examine the bar chart and answer the following questions.
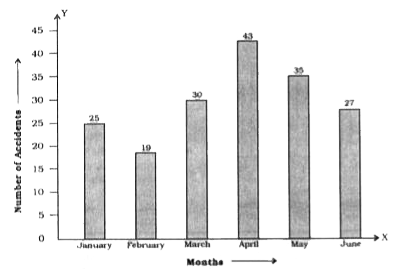
What is the percentage of accidents in the month of April to the total accidents in the city ?View SolutionThe bar-chart is showing the number of accidents in a city during the first six month of a year. Examine the bar chart and answer the following questions.
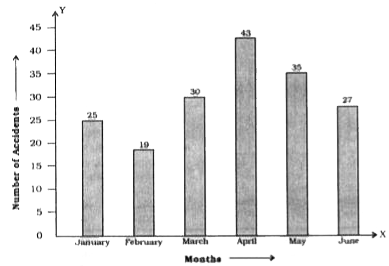
Compared to the month of January, what is the percentage of decrease in accidents in the month of February?View SolutionThe bar-chart is showing the number of accidents in a city during the first six month of a year. Examine the bar chart and answer the following questions.
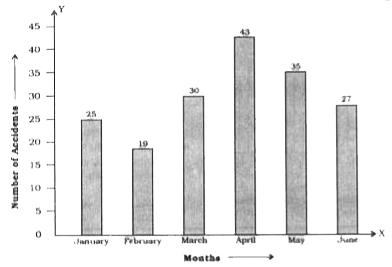
By what number, is the number of accidents that occurred in April is greater than the average number of accidents that occured during the 6 months period ?View SolutionThe number of road accidents in a city is increasing month by month as given below. Find out the number of accidents in the month of June.
 View Solution
Given below is a bar diagram showing the percentage of Hindus, Sikhs and muslims in a state during the years 1989 to 1992.
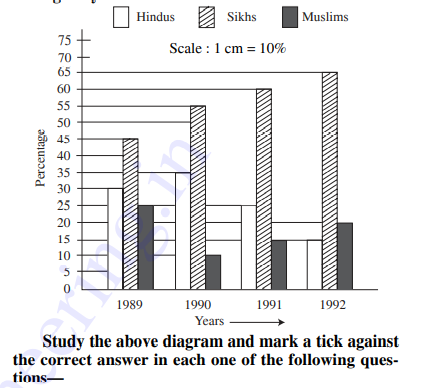
What percentage was the decrease in hindus population from 1989 to 1992 ?View SolutionThe given table represents the number of computers sold by four dealers A, B, C and D during the first six months of 2016. Study the table carefully and answer the question that follows.
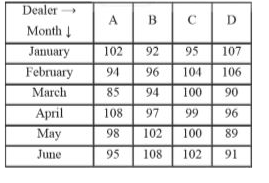
The total number of computers sold by dealer B in April, May and June is what percentage of the total number of computers sold by all the dealers in February and April?View SolutionThe following distribution gives the number of accidents met by 160 workers in a factory during a month. No. of accidents (x) : 0 1 2 3 4 No. of workers (f) : 70 52 34 3 1 Find the average number of accidents per worker.
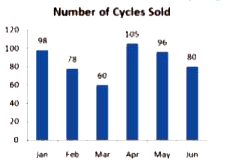
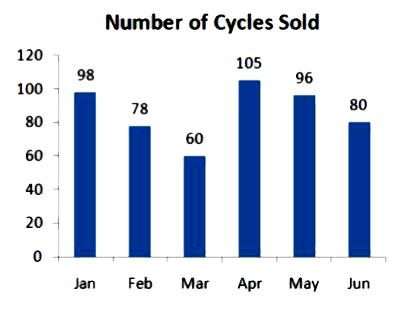
View SolutionThe bar graph shows the number of cycles sold by a distributor in each month from January to June. Whatis the increase in the number of cycles sold in April as compared to March?
 View Solution
The bar graph shows the number of cycles sold by a distributor in each month from January to June. Whatis the increase in the number of cycles sold in April as compared to March ?
 View Solution

