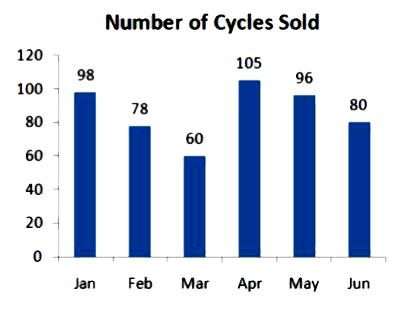
The bar graph shows the number of cycles sold by a distributor in each month from January to June. Whatis the increase in the number of cycles sold in April as compared to March ?
75%
78%
68%
70%
The correct Answer is:A
Step by step video & image solution for The bar graph shows the number of cycles sold by a distributor in each month from January to June. Whatis the increase in the number of cycles sold in April as compared to March ? by Maths experts to help you in doubts & scoring excellent marks in Class 14 exams.
Updated on:21/07/2023Similar Questions
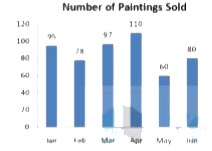
The bar graph shows the number of paintings sold by an art gallery in each month from January to June. How many paintings does it need to sell in July for the 7 month average to be 90?
View SolutionStudy the bar diagram and answer the following questions.
The bar diagram shows the number of bicycles parked in the parking space of a hall at various points of time.
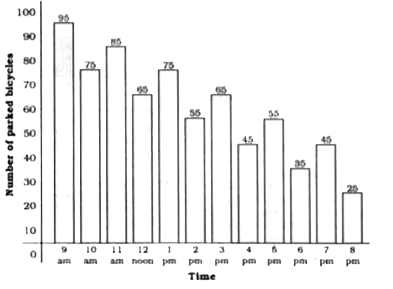
What is the average number fo parked cycles as seen from the graph ?
View Solution
Knowledge Check
The bar chart given below shows the number of cars sold by brand A and B for the year for 2008 to 2016
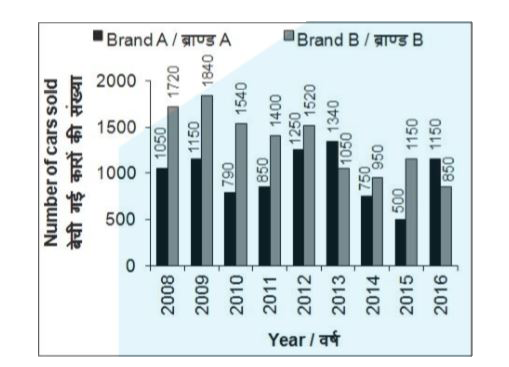
What is the percentage decrease in the number of car sold in year 2015 from year 2014 for brand A?A50B20C25D33.33The Bar graph given below presents the number of books sold by a bookseller during different months of a year.
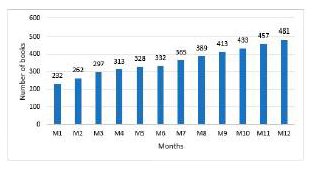
What is the total number of books sold by the bookseller in the year?A4032B4132C4302D4202The bar graph given below represents the number of boys in a school using three apps for three months.
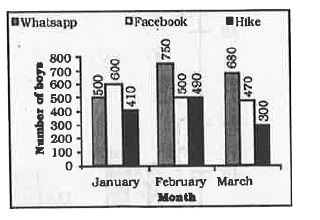
What is the percentage decrease in the number of boys using Facebook from January to February?A26.66B20C21.33D16.66
The given bar graph shows the number of cars sold from Jan to Dec.
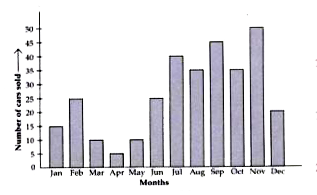
How many cars were sold in the last quarter of the year?
View SolutionThe bar graph shows the number of cars of different brands sold by a dealer in a month. Study the diagram and answer the following question.
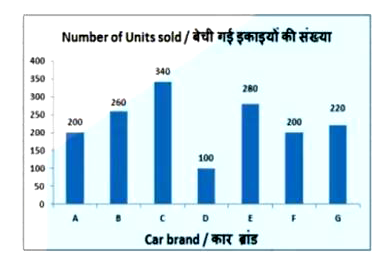
What is the ratio of units sold of brand G to that of brand E?
View SolutionThe bar graph shows the number of cars of different brands sold by a dealer in a month. Study the diagram and answer the following question.
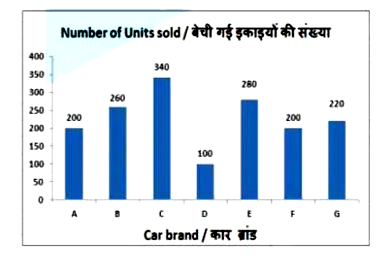
Units sold of which car brand were the second highest?
View SolutionThe bar graph shows the number of motorcycles of different brands sold by a dealer in a month . Study the diagram and answer the following questions .
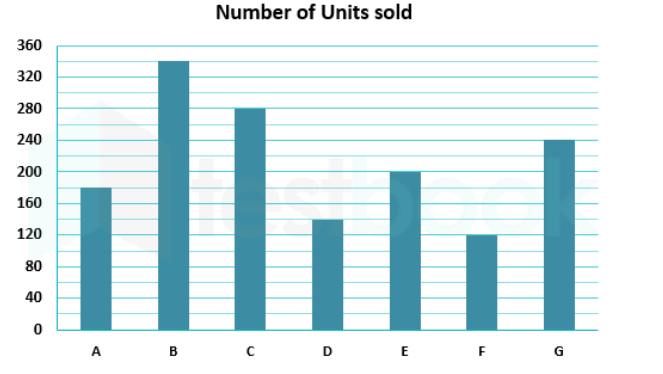
What is the ratio of units sold of brand A to that of brand C?
View SolutionThe bar graph shows the number of cars of different brands sold by a dealer in a month, Study the diagram and answer the following question.
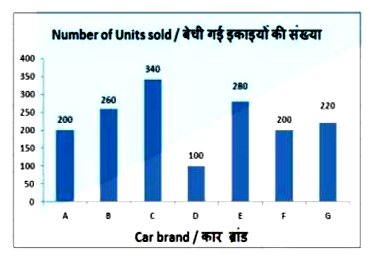
If the average price of a car sold by the dealer is Rs 5 lakhs then what is the sales (in Rs lakhs) of all the cars sold by the dealer in the month?
View Solution
