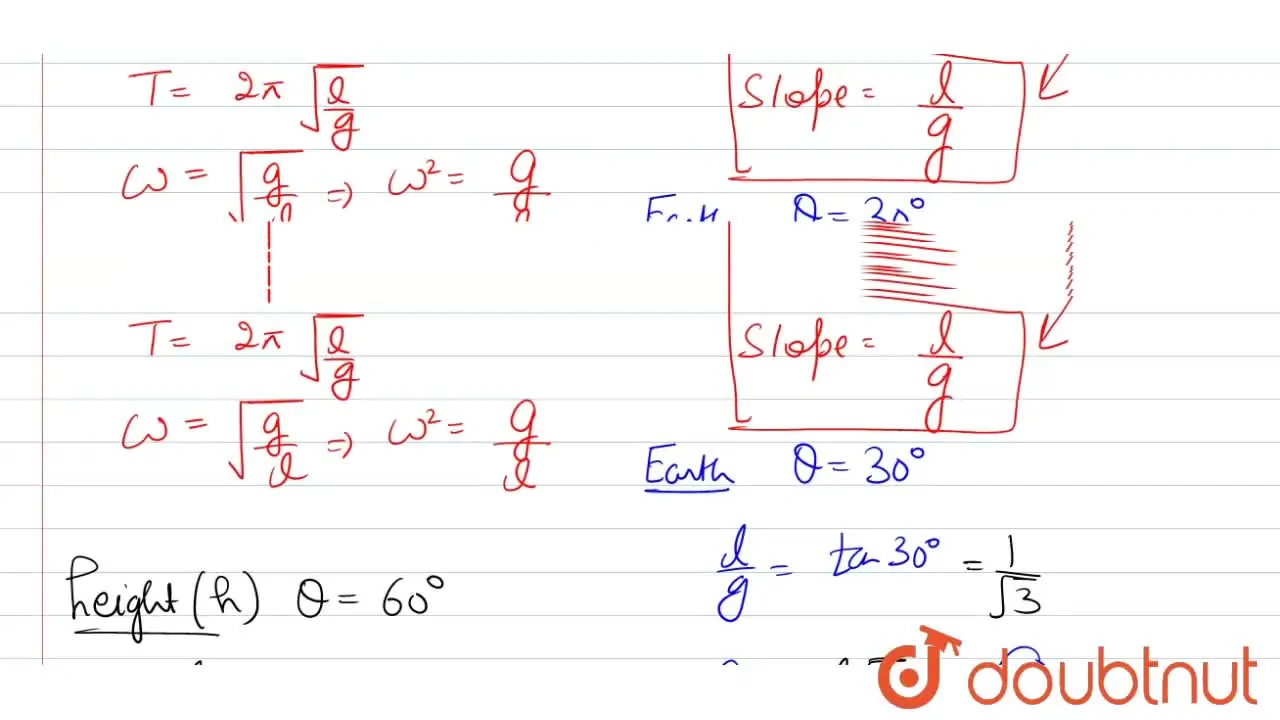
In an experiment, a boy plots a graph between (vmax)2and(amax)2 for a simple pendulum for different values of (small) amplitudes, where vmaxand amax is the maximum velocity and the maximum acceleration respectively. He found the graph to be a straight line with a negative slope, making an angle of 30∘ when the experiment was conducted on the earth surface. When the same experiment was conducted at a height h above the surface, the line was at an angle of 60∘. The value of h is [radius of the earth = R]
0.5R
0.24R
0.73R
R
The correct Answer is:C
Step by step video & image solution for In an experiment, a boy plots a graph between (v_(max))^(2)and (a_(max))^(2) for a simple pendulum for different values of (small) amplitudes, where v_(max)and a_(max) is the maximum velocity and the maximum acceleration respectively. He found the graph to be a straight line with a negative slope, making an angle of 30^(@) when the experiment was conducted on the earth surface. When the same experiment was conducted at a height h above the surface, the line was at an angle of 60^(@). The value of h is [radius of the earth = R] by Physics experts to help you in doubts & scoring excellent marks in Class 12 exams.
Similar Questions
In Searl's experiment a graph is plotted between
View SolutionA simple pendulum has a time period T1 when on the earth's surface and T2 when taken to a height R above the earth's surface, where R is the radius of the earth. The value of T2T1 is
View SolutionTwo identical pendulums oscillate with a constant phase difference π4 and same amplitude. If the maximum velocity of one is v, the maximum velocity of the other will be.
View Solutionif the maximum and minimum voltage of AM wave are Vmax and Vmin, respectively then modulation factor
View SolutionFor maximum deviation Dmax.
View SolutionIn an experiment , to find the loss of energy with respect to time in case of swinging simple pendulum , the graph between (amplitude)2 and time is
View SolutionTwo particles are moving with velocities v1andv2 . Their relative velocity is the maximum, when the angle between their velocities is
View SolutionThe displacement-time graph for two particles A and B are straight lines inclined at angles of 30∘ and 60∘ with the time axis. The ratio of velocities of VA:VB is
View SolutionThe displacement-time graph for two particles A and B are straight lines inclined at angles of 30∘ and 60∘ with the time axis. The ratio of velocities of VA:VB is
View SolutionA particle executes linear. If a and v donate the acceleration and velocity of the particle respectively, then correct graph relating the values a2 and v2 is
View Solution


