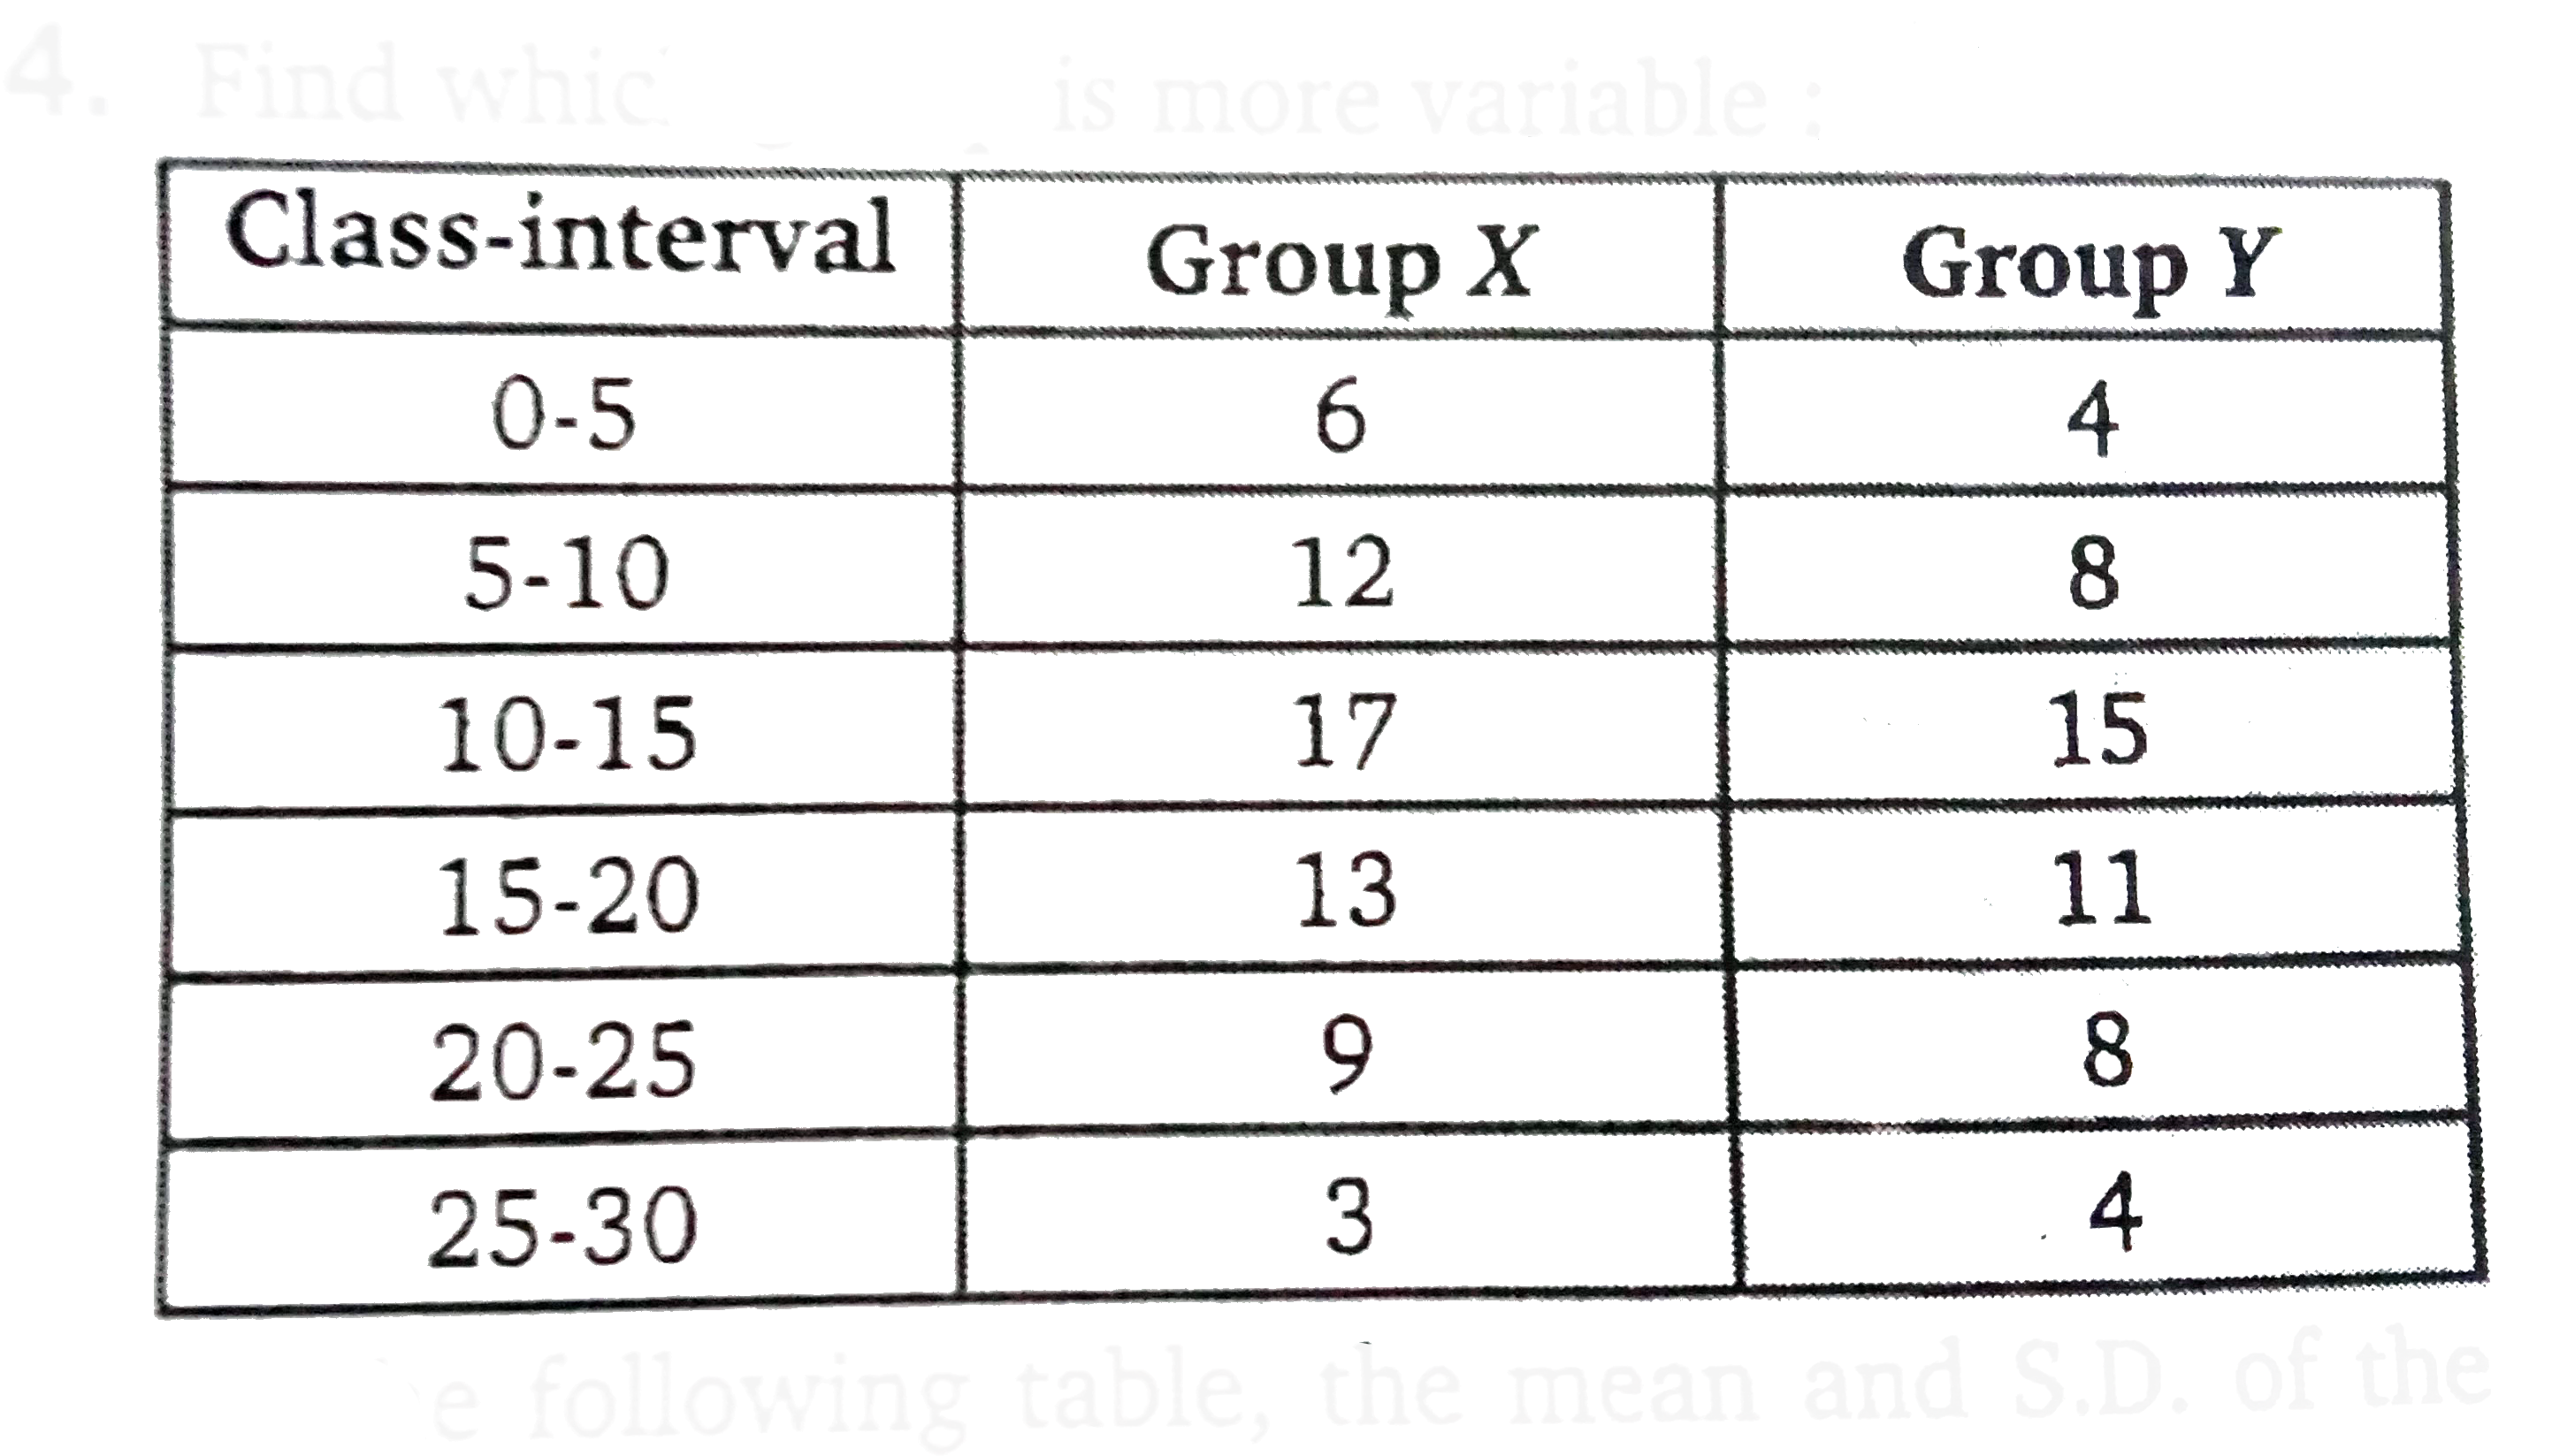
From the data given below state which group is more variable A or B?
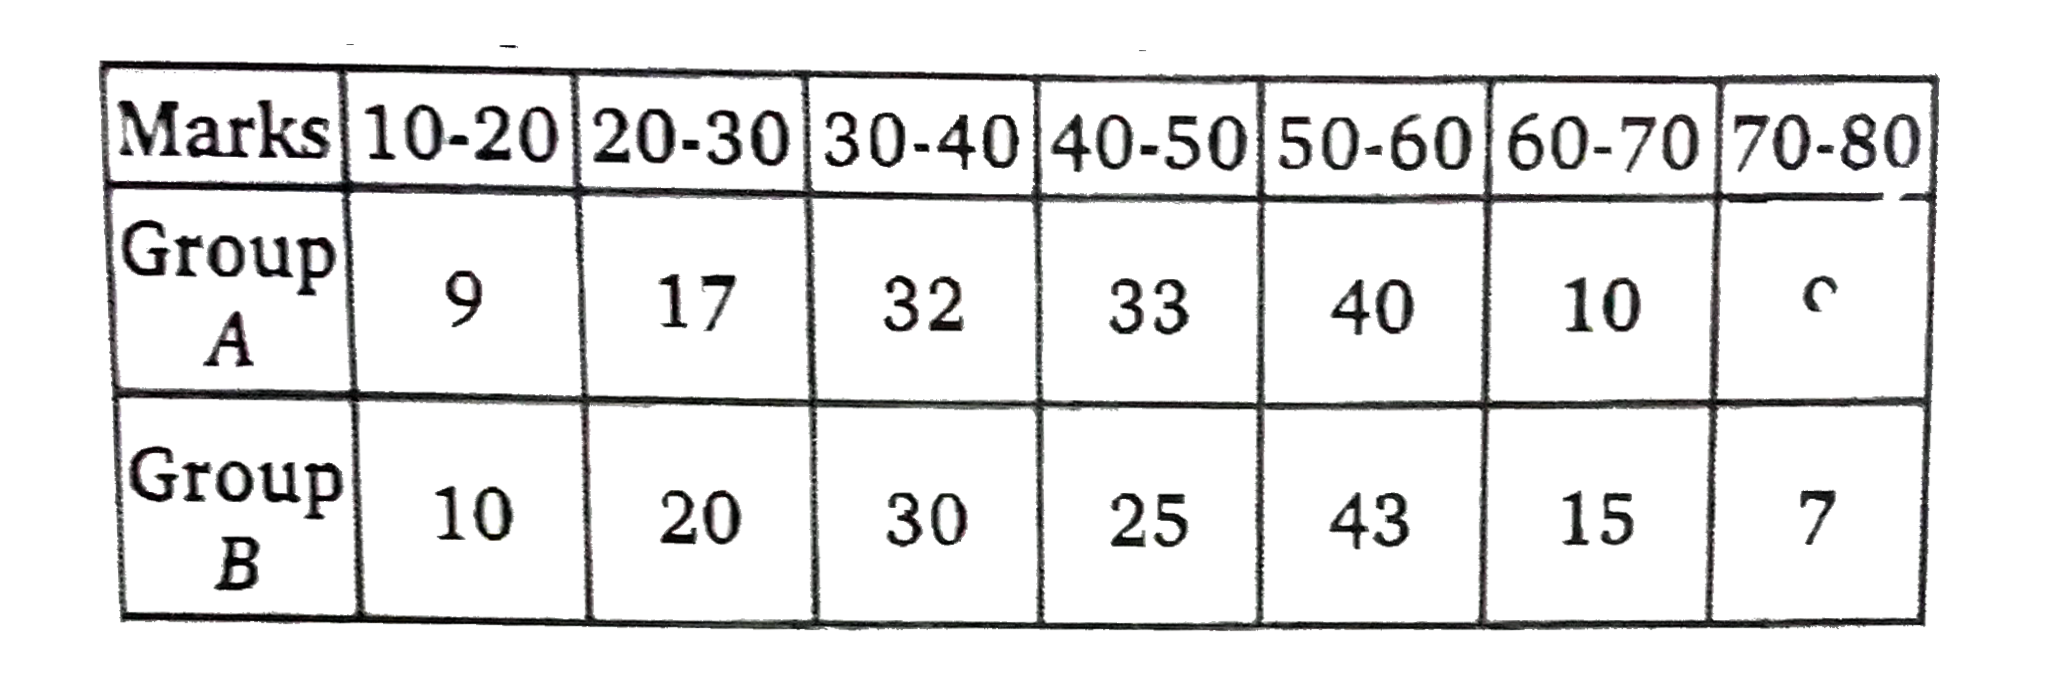
Let assumed mean A=45 and h=10 For group A
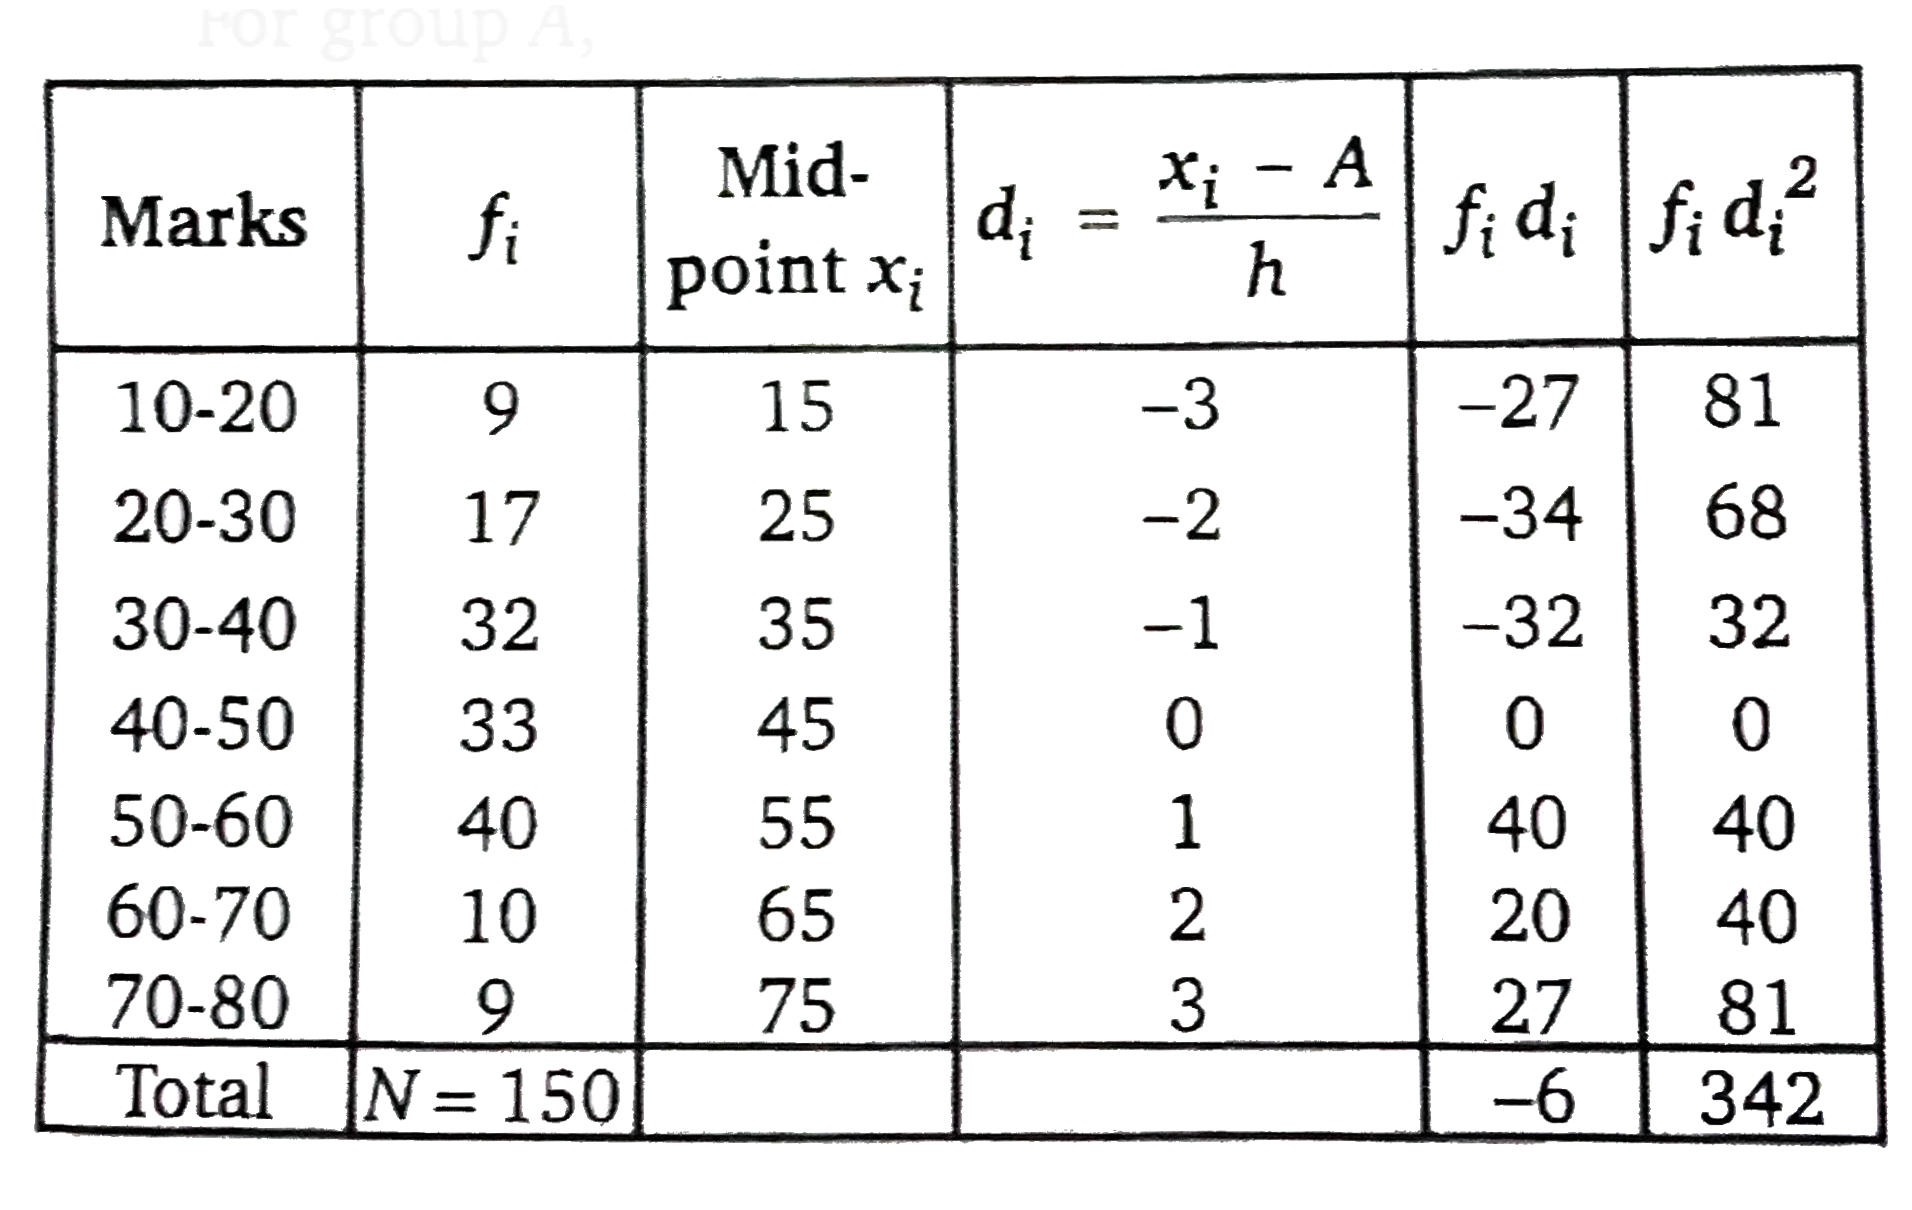
Variance σ2=h2⎡⎣∑fid2iN−(∑fidiN)2⎤⎦
=102[342150−(−6150)2]
=100[51300−36150×150]
=51264225=227.84
For group B
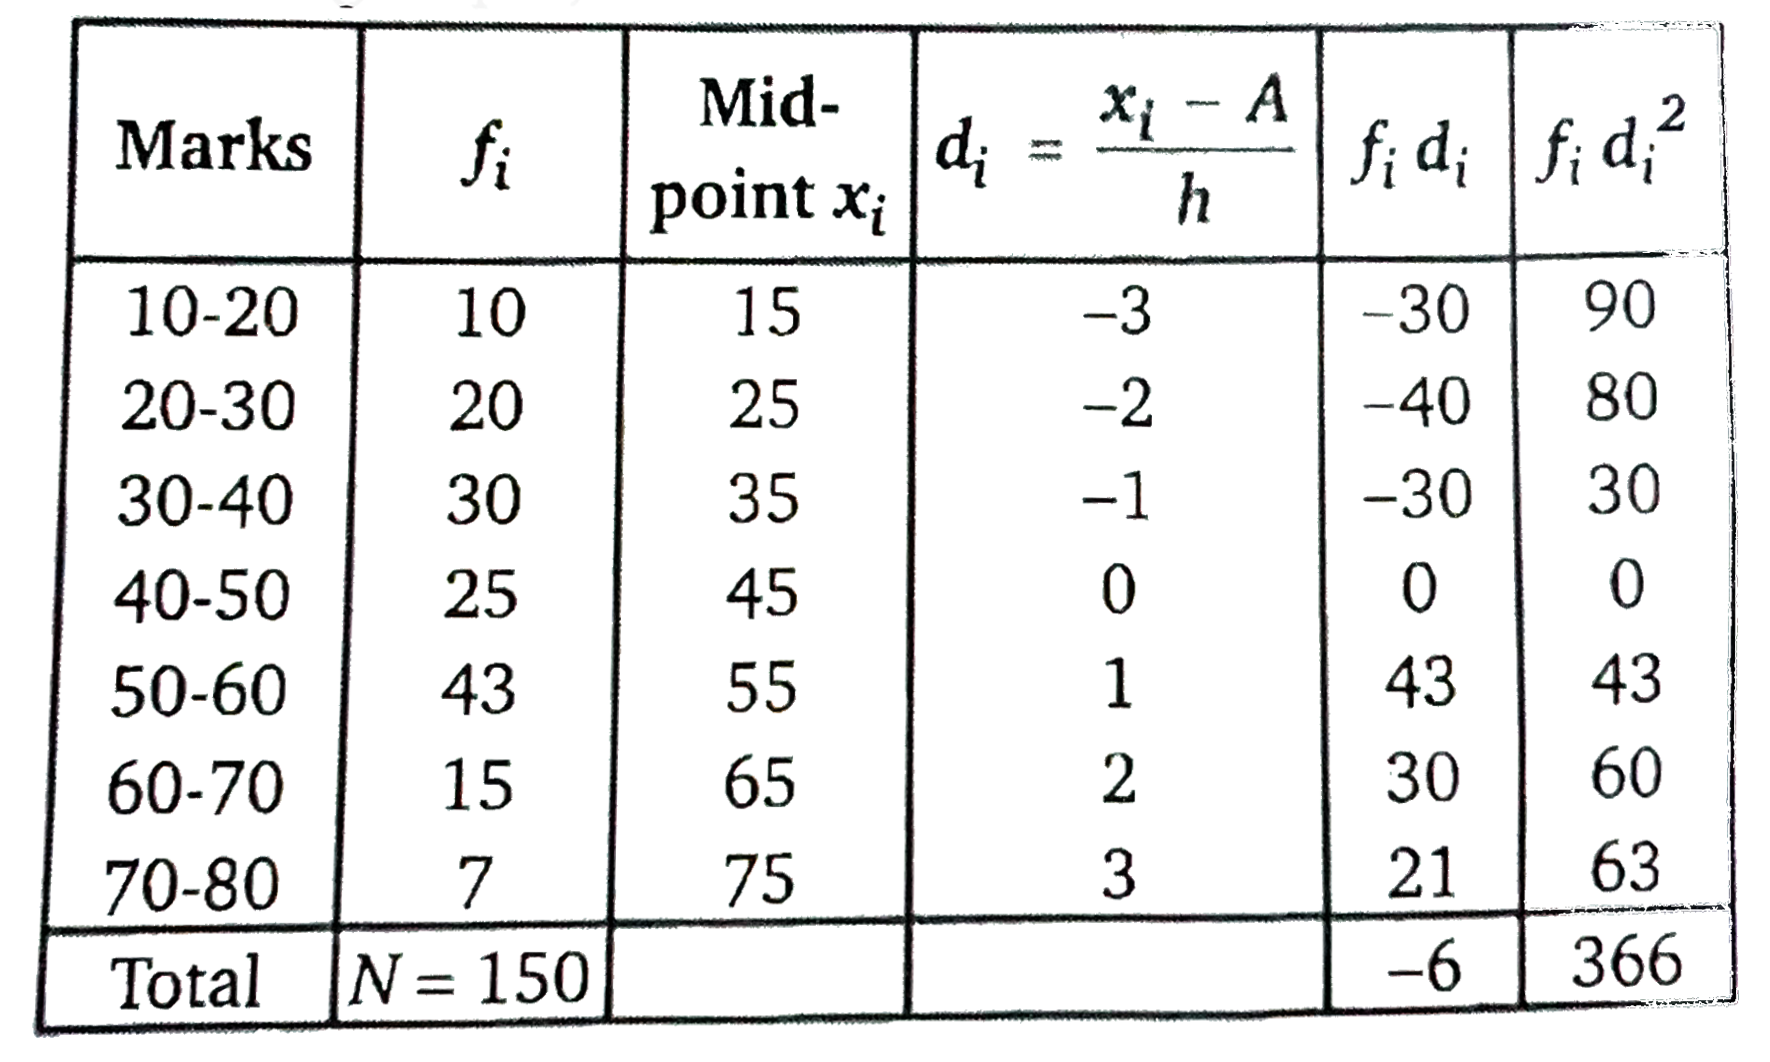
Variance σ2=h2⎡⎣∑fid2iN−(∑fidiN)2⎤⎦
=102[366100−(−6150)2]
=100[54900−36150×150]
=54864225=243.84
∴ The variance of group B is more
∴ The data of group B is more variable.
Topper's Solved these Questions
- STATISTICSBOOK - NAGEEN PRAKASHAN ENGLISHCHAPTER - STATISTICSEXERCISE - MISCELLANEOUS EXERCISE
7 Videos
- STATISTICSBOOK - NAGEEN PRAKASHAN ENGLISHCHAPTER - STATISTICSEXERCISE - EXERCISE
20 Videos
- SETSBOOK - NAGEEN PRAKASHAN ENGLISHCHAPTER - SETSEXERCISE - MISC Exercise
16 Videos
- STRAIGHT LINESBOOK - NAGEEN PRAKASHAN ENGLISHCHAPTER - STRAIGHT LINESEXERCISE - Exercise
207 Videos
Similar Questions
From the data given below state which group is more variable G1orG2? Marks, 10-20, 20-30, 30-40, 40-50, 50-60, 60-70, 70-80 Group G1 , 9, 17, 32, 33, 40, 10, 9 Group G2 , 10, 20, 30, 25, 43, 15, 7
View SolutionFrom the data given below state which group is more variable G1orG2? Marks 10-20 20-30 30-40 40-50 50-60 60-70 70-80 Group G1 9 17 32 33 40 10 9 Group G2 10 20 30 25 43 15 7
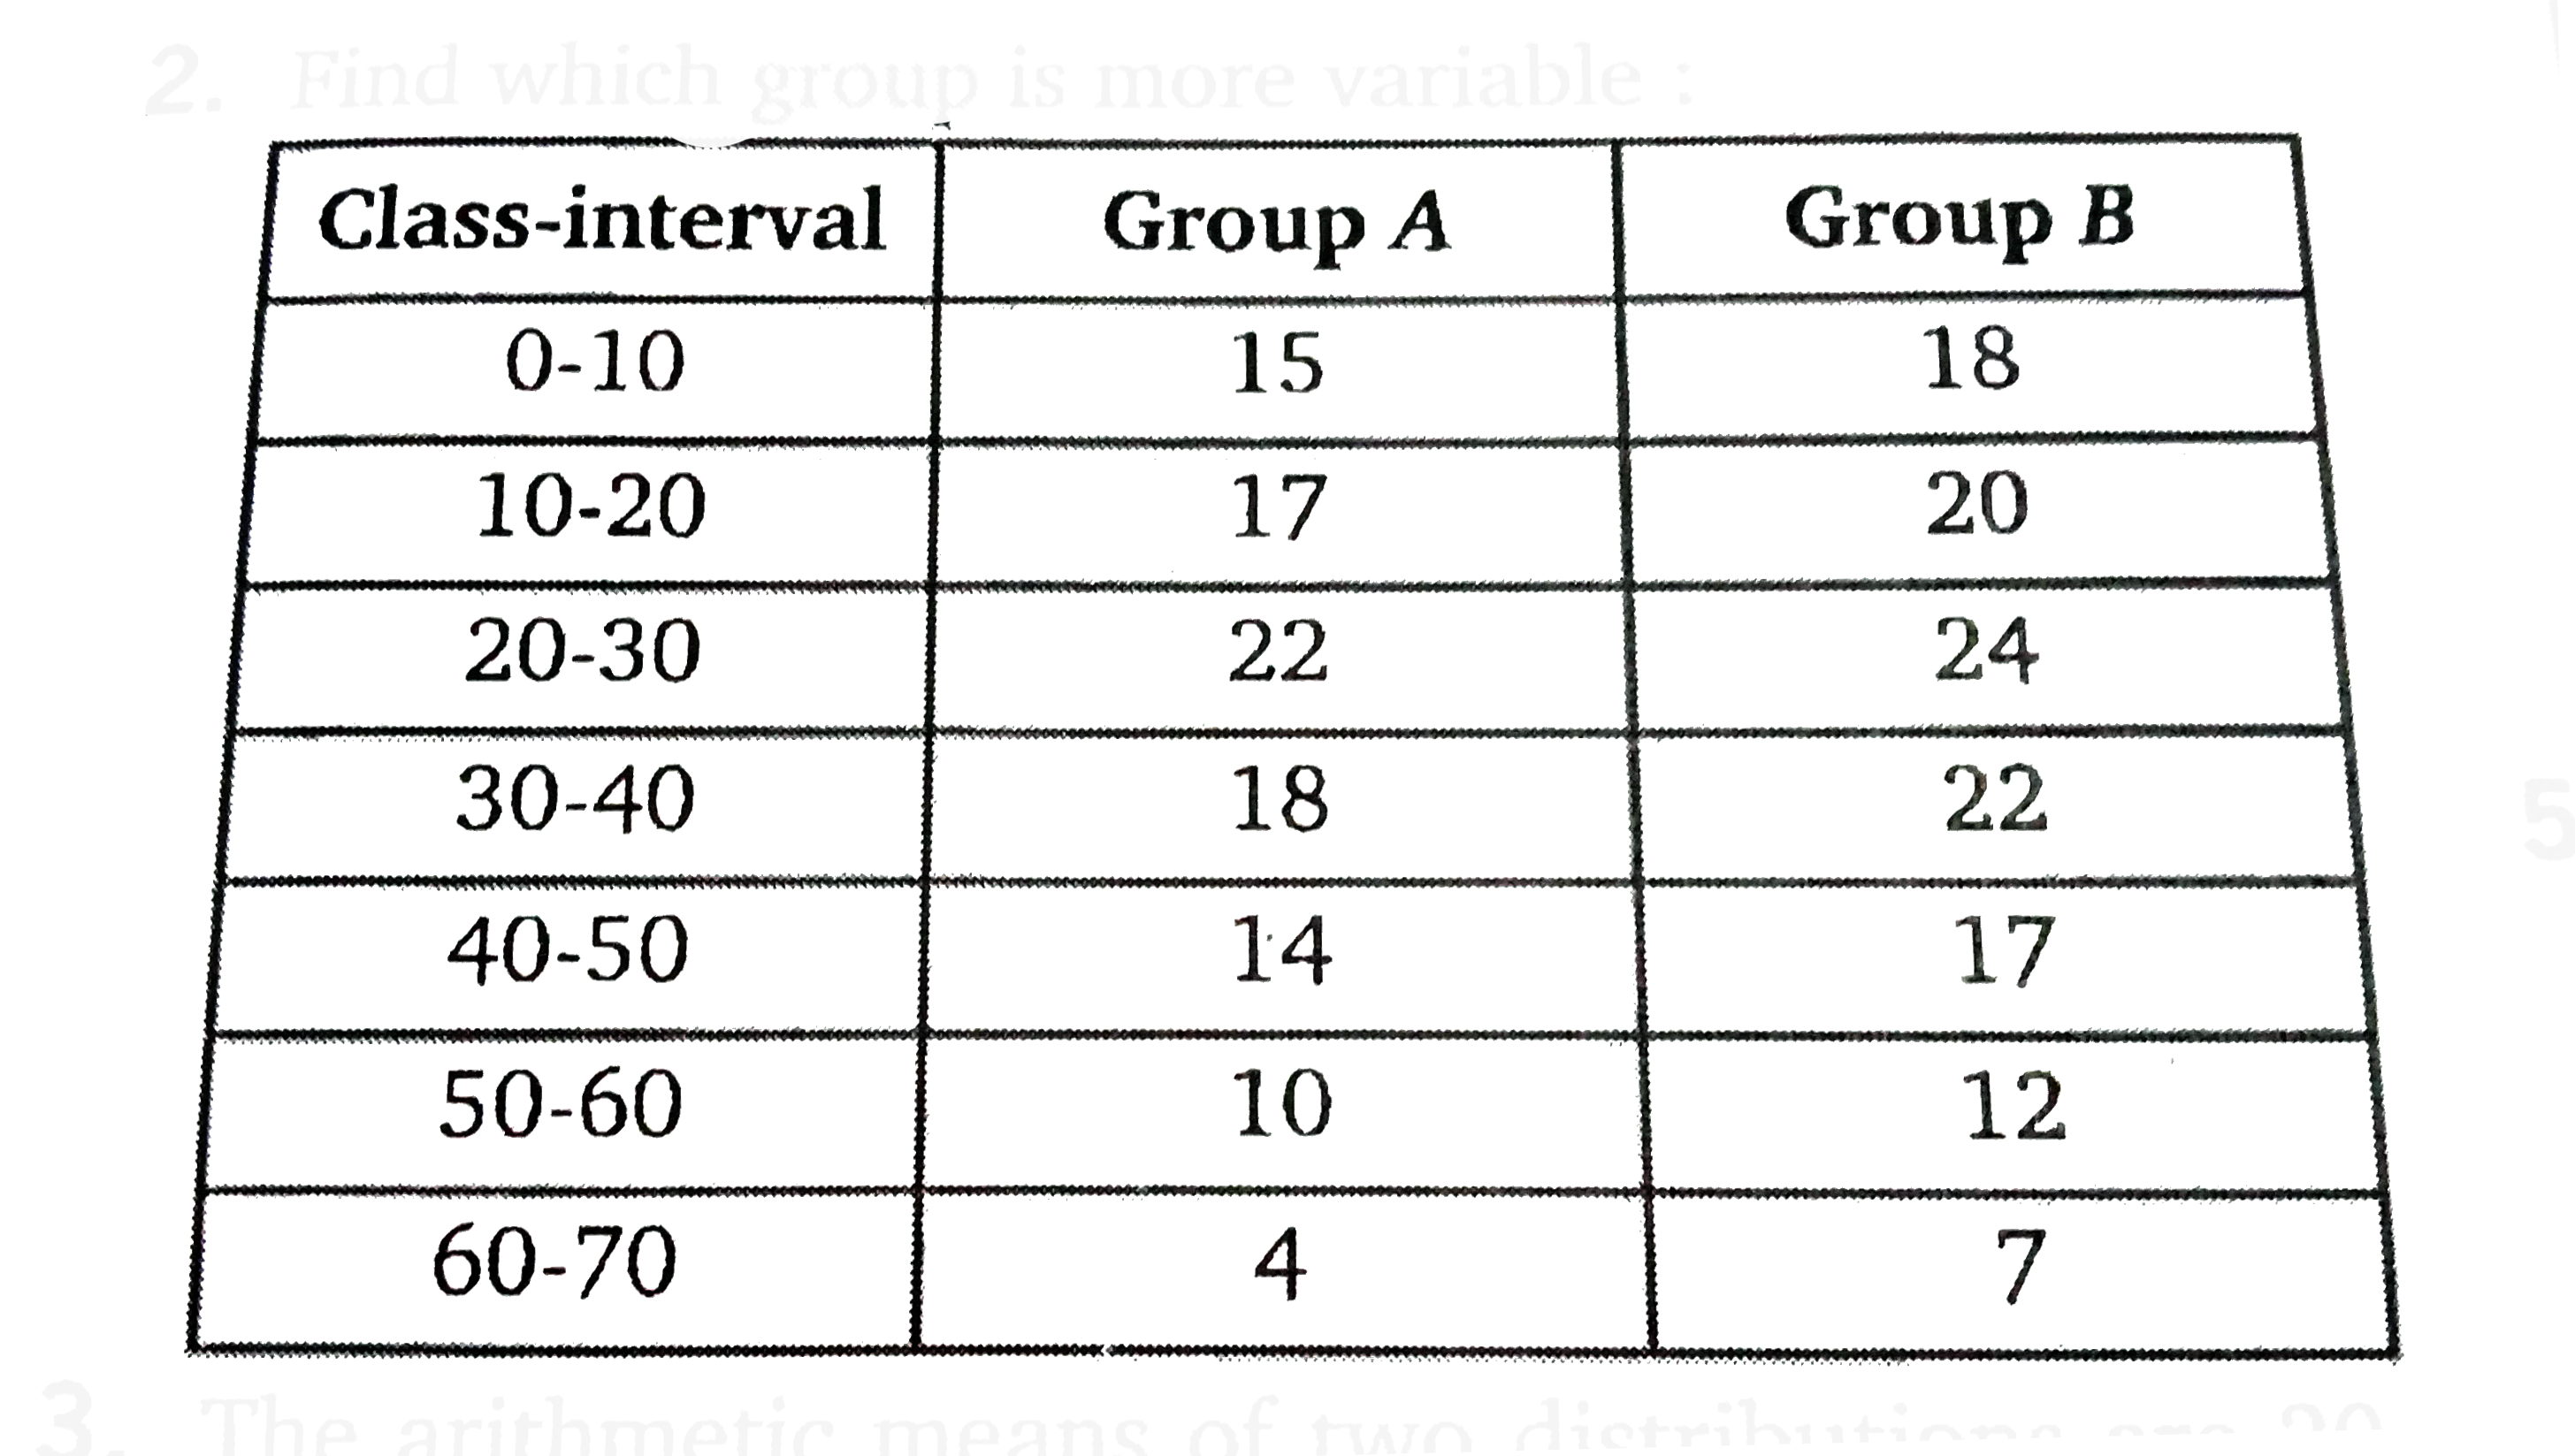
View SolutionFind which group is more variable:
View SolutionFind which group is more variable:
View SolutionIn which group are animals more alike
View SolutionFrom the diagram given below:
State the law which explains this observation.
View SolutionForm the data given below for the reaction:A→B→ Products
the rate law expression is:
View SolutionDraw the graph obtained from the table below:

Use the graph to find the value of a,b and c. State a linear relation between the variables x and y.
View SolutionDraw the graph obtained from the table below:

Use the graph to find the values of a,b and c. State a linear relation between the variables x and y.
View SolutionWhich element in the given below does not show variable valency ?
View Solution
